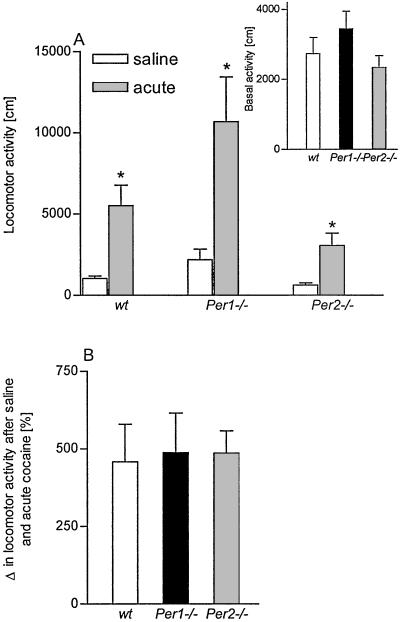
Figure 1.
Basal locomotor activity and acute cocaine response in Per mutants. Locomotor responses to saline and single cocaine injections in wild-type (wt) mice or mice carrying a mutation in mPer1 or mPer2 genes are shown. (A) The graph shows the activity after saline and acute cocaine injections (* indicates a significant difference to saline treatment P < 0.05). (Inset) The basal locomotor response during a period of 30 min [F(2,36) = 1.38. P = 0.26]. (B) The increase in locomotor activity after an acute cocaine injection was also calculated as percentage difference in activity to a saline injection. One-way ANOVA did not show statistical differences between the three genotypes [F(2,39) = 0.046, P = 0.9]. All data are presented as mean ± SEM.

