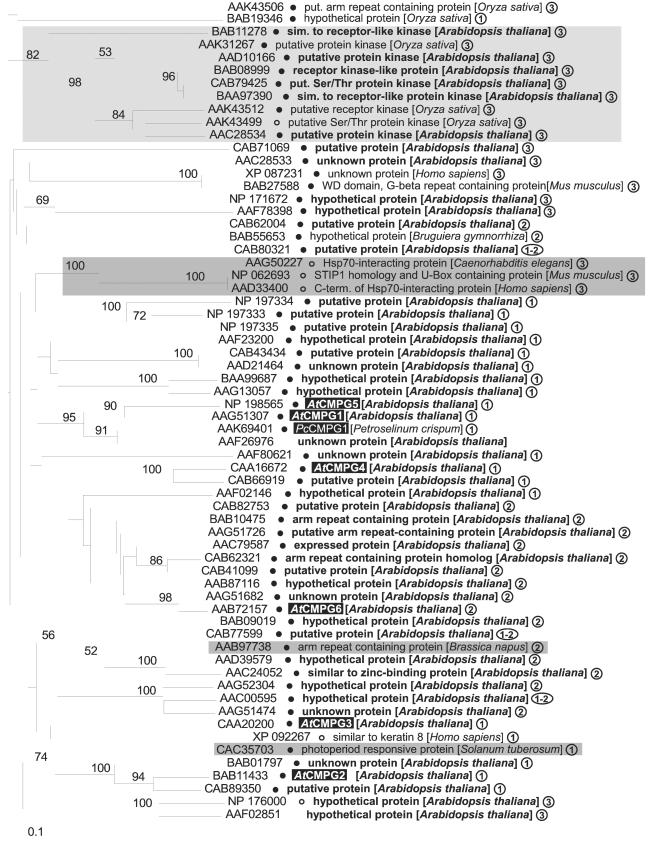
Figure 4.
Predicted phylogenetic relationships among all proteins from A. thaliana and other species that follow the criteria for sequence similarity defined in the text. See text also for explanation of symbols (filled and open circles) and definition of the three structural types ①–③. Numbers above branches indicate frequencies within 100 bootstrap replicates (shown only for values >50%). Dark shading, functionally identified proteins; light shading, proteins reported to be putative kinases.

