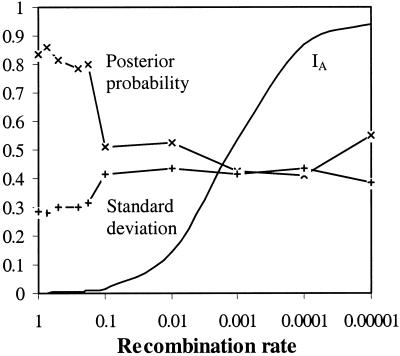
Figure 2.
Mean posterior probabilities for assignment to their original source population for isolates selected from simulated populations with varying recombination rates. Reference sample populations of 30 isolates and 20 loci are used with Fst set to ≈0.2. Posterior probabilities (line marked with ×) and their associated SDs (line marked with +) are marked, as well as a curve plotting the increase of the standardized IA across the simulations.

