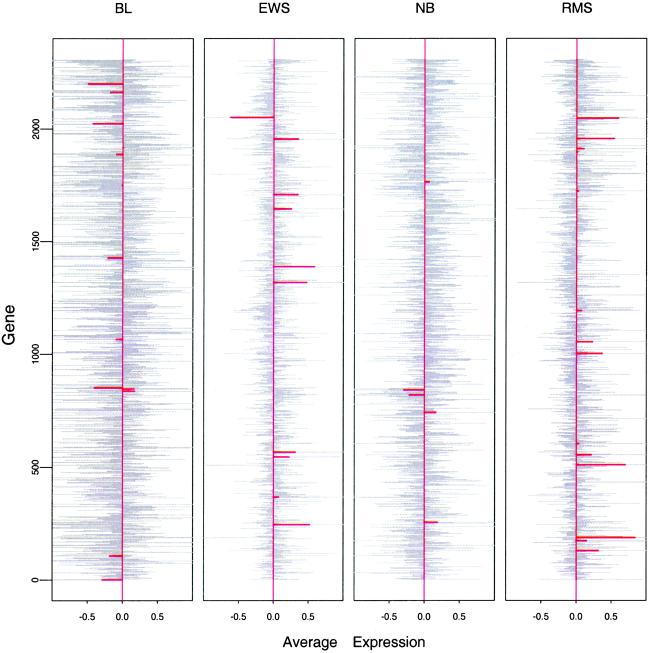
Figure 1.
Centroids (grey) and shrunken centroids (red) for the SRBCT dataset. The overall centroid has been subtracted from the centroid from each class. The horizontal units are log ratios of expression. From left to right, the numbers of training samples for each class are 8, 23, 12, and 20. The order of the genes is arbitrary.

