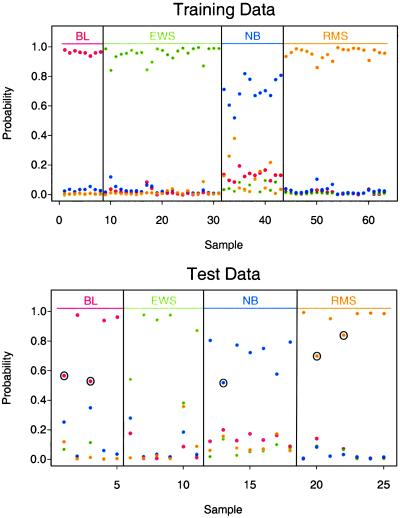
Figure 5.
Estimated probabilities for the training data (Upper) and test data (Lower). Samples are partitioned by the true class (Upper) and the predicted class (Lower). All 63 of the training samples and all 20 of the test samples known to be SRBCT are correctly classified. Five of the test samples were non-SRBCT and hence should not be classified as such. The maximum estimated probability for each of these five samples is marked with a circle; they are below the maximum probabilities for the other test samples in each class.

