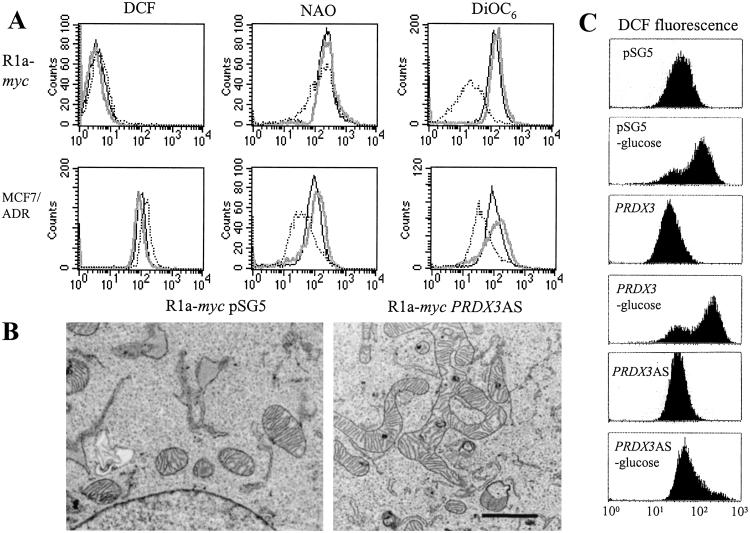
Figure 4.
PRDX3 affects mitochondrial membrane integrity and morphology. (A) Histograms generated by FACS analysis of cells incubated with dye specific for cellular reactive oxygen species (DCF), mitochondrial mass (NAO), or mitochondrial membrane potential (DiOC6): pSG5 (solid black line), PRDX3 (solid gray line), PRDX3AS (dotted line). (B) Transmission electron microscopy of R1a-myc-pSG5 and R1a-myc-PRDX3AS cells. (Bar = 1 μM.) (C) Analysis of ROS after glucose deprivation. Cells were exposed to glucose-free media for 1.5 h before incubation with DCFH-DA.

