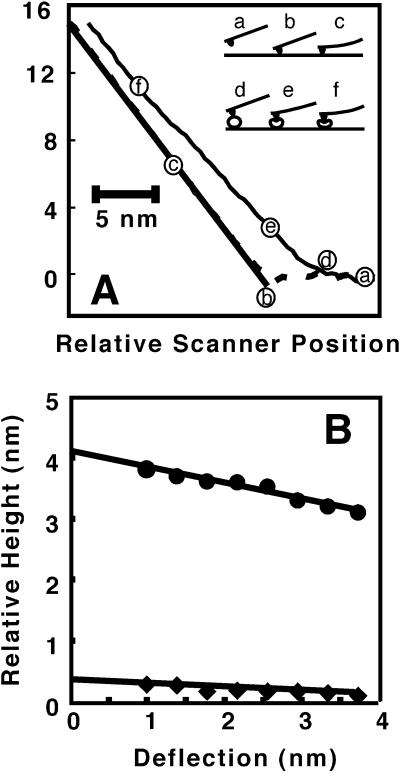
Figure 4.
(A) Force curve in approach direction taken on a cytochrome P450 molecule (thin line), rHDL surface (dashed line), and theoretical hard surface (thick line). Curves are averages of several force curves. (Inset) Regions of force curves on a hard surface [(a) noncontact, (b) point of contact, and (c) region of constant compliance] and on a protein [(d) region of contact with protein, (e) deformation, and (f) region of constant compliance]. (B) Relative height as a function of cantilever deflection. Lines are least squares fits with intercepts of 0.39 ± 0.03 nm (rHDL) and 4.13 ± 0.06 nm (CYP2B4) giving an extrapolated height for CYP2B4 above the rHDL surface of 3.74 ± 0.07 nm.

