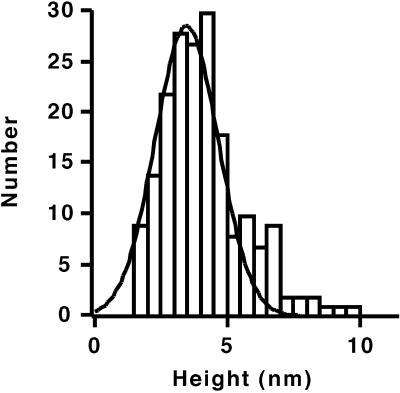
Figure 5.
Histogram of the height of cytochrome P450 molecules above the rHDL surface measured by extrapolation to zero cantilever deflection. The solid line is a Gaussian fit having a peak at 3.5 nm with a SD of 0.9 nm. Data were taken for 191 cytochrome P450 molecules from 12 areas of a sample. Relative heights were linearly extrapolated to cantilever deflection values of zero, using four points of the height vs. deflection curves at cantilever deflections between 1 and 3 nm. The relative height of the rHDL surface was subtracted from the relative height of cytochrome P450 to obtain the height of cytochrome P450 above the rHDL surface.

