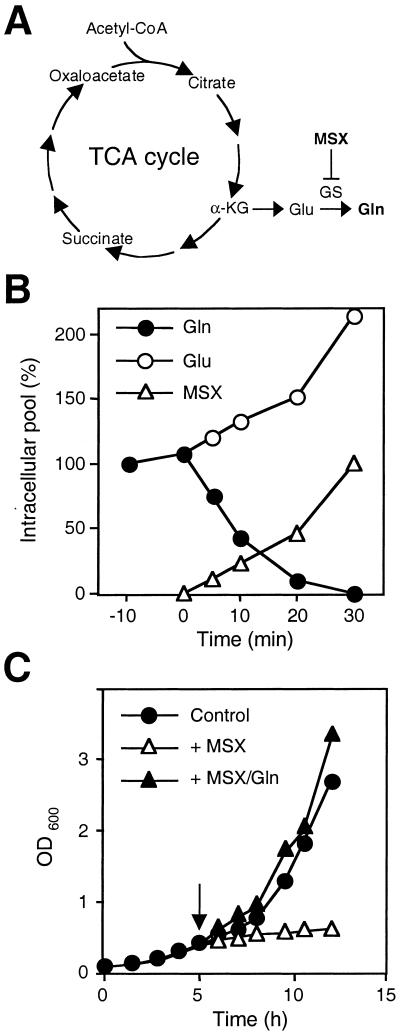
Figure 1.
(A) Schematic drawing of the TCA cycle and metabolic reactions for the synthesis of glutamine. α-KG, α-ketoglutarate. (B) Effect of MSX on the size of the intracellular pools of glutamine and glutamate. Wild-type (JK9–3da) cells were grown in SD and treated with MSX. Time refers to MSX treatment. MSX was added at 0 min. A 100% glutamine pool corresponds to 13.1 μmol/g of protein; a 100% glutamate pool corresponds to 42.4 μmol/g of protein. Open triangles refer to the intracellular accumulation of MSX. A 100% MSX pool corresponds to 19.9 μmol/g of protein. (C) Effect of the GS inhibitor MSX on cell growth. Wild-type (JK9–3da) cells were grown in SD and treated with MSX (2 mM) (▵) or simultaneously with MSX and glutamine (5 mM) (▴). Control refers to nontreated cells (●). The arrow indicates time of treatment.

