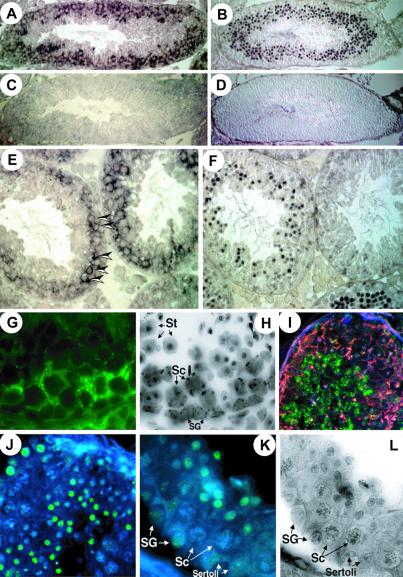
Figure 4.
Mutually exclusive expression patterns of BORIS and CTCF correlate with epigenetic reprogramming in testis. (A and E) Immunostaining of thin (5-mm) sections of adult mouse testis with the affinity-purified anti-BORIS antibodies visualized by secondary alkaline phosphatase-conjugated rabbit anti-IgY antibodies. (B and F) Expression in adult mouse testis sections visualized using affinity-purified anti-N-CTCF antibodies and secondary alkaline phosphatase-conjugated antibodies. (C and D) Control staining obtained with normal chicken and rabbit serum, respectively. (G) BORIS-expressing cells in mouse tubule visualized by secondary FITC-labeled antibodies. (H) 4′,6-diamidino-2-phenylindole (DAPI)-inverted image of G. (I) Dual immunohistochemical staining by chicken ap-2-Ab anti-BORIS antibodies (Rhodamine fluorescence, red) and anti-5mC antibodies (FITC fluorescence, green). (J) Anti-5mC staining (FITC with DAPI counterstaining) at lower magnification. (K) Identification of the cell types with methylated DNA within the tubule, SG, Sertoli cells, and St. Note methylation free Sc. (L) An inverted DAPI image of K. (Magnification: A–D, 12-fold; E and F, 50-fold; G, H, K, and L, 106-fold; I and J, 44-fold.)

