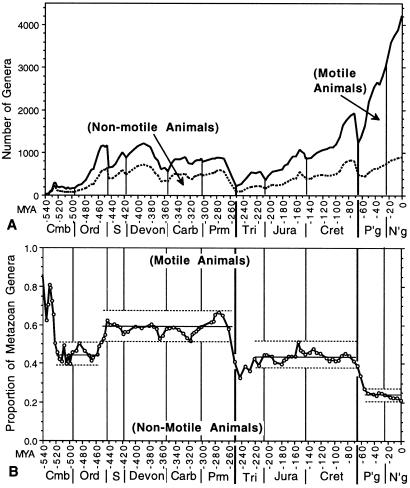
Figure 1.
Comparison of genus diversity and proportional diversity of motile (active) and nonmotile (passive) marine metazoans through the Phanerozoic Eon; groups designated in Table 1. (A) Genus diversity of the two groups. The data are number of genera (and subgenera of molluscs) crossing interval boundaries. The top line represents the total genus diversity of tabulated marine animals. The dotted line divides the nonmotile group (below) from the motile group (above). (B) The proportion of marine metazoan genus diversity comprising nonmotile taxa. (The proportion of motile marine genera is the complement.) Light horizontal lines bracket the range of proportion and the solid line indicates mean proportion over each of the four intervals of stability discussed in the text. Because our interest is in the long intervals of restricted range of proportion of nonmotile taxa rather than the determination of whether any one value is or is not statistically significantly different from another value, we do not show 95% confidence intervals around each datum. However, confidence intervals are all narrow (ranging from ±0.08 units, or 8%, for a Cambrian interval with only 149 genera to ±0.016 units for a Cenozoic interval with 3,018 genera). Confidence intervals for a majority of the data in each “stable interval” do not overlap with those in adjacent stable intervals, although individual extreme values in different stable intervals may have overlapping confidence intervals. More apropos for the subject of this paper, the Mann–Whitney U test demonstrates that the suite of proportions in each stable interval differs from that in the succeeding or preceding interval with P < 0.001. This is not surprising because the values in each stable interval do not overlap those of the adjacent intervals. There are many groups in each category (Table 1) and those taxa vary independently in diversity through time, with great diversity “turnover” within each stable interval. Diversity fluctuates or increases by a factor of two or more during each stable interval, more than enough to permit marked change in the proportional relations noted here, especially given the independence of the many lineages involved. Also, the transitions that do occur between stable intervals take place in as little time as two intervals (from the start of the Mid Caradoc to the end of the Late Caradoc, from the start of the Danian to the end of the Paleocene). These three factors together demonstrate that, although the data are from the time series of the history of marine diversity, autocorrelation alone was not a major factor in maintaining the narrow range of proportions characterizing each stable interval. To address any concerns about autocorrelation, however, we calculated the Mann–Whitney U test for every other datum in each stable interval (valid in this case because none of the values in any stable interval overlap with those of the adjacent intervals to which they are being compared, so summed ranks for any group of half the data in each interval would produce the same result). The adjacent stable intervals are still highly significantly different (P < 0.001). The same statistical points hold, in general, for the other two analyses (physiological grouping and proportion of predators) presented below.

