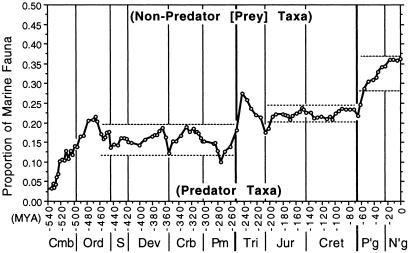
Figure 3.
The proportion of tabulated marine genera comprising predators through the Phanerozoic Eon. [The proportion of nonpredator (“prey”) taxa is the complement; data discussed in detail in ref. 31.] Light horizontal lines bracket the range of proportion over the three post-Caradoc intervals of stability of proportion similar to those discussed for the functional and physiological groupings documented in the text. Note that the y-axis scale only extends to 0.50, not 1.00 as in Figs. 1B and 2. Predators are generally motile taxa, which as a group increase in proportion of metazoan diversity at the expense of nonmotile forms (Fig. 1B). Nonpredator taxa also include motile organisms, however, so changes in the proportional representation of predators do not simply reflect the changing proportion of motile taxa.

