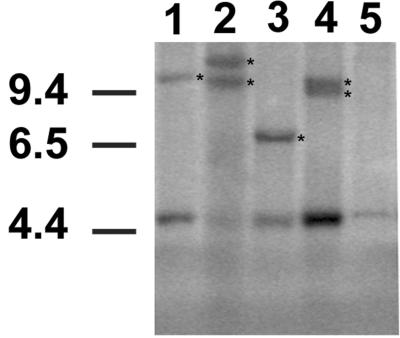
Figure 5.
Southern blot analysis of IgH gene rearrangements in leukemias from TG mice. DNAs from leukemic mice and a littermate control were digested with StuI. The strong 4.7-kb bands represent the gene in its germ-line configuration. Clonal rearrangements are indicated by asterisks. Lanes 1 and 2, Leukemic mice from TG line F3; lanes 3 and 4, leukemic mice from TG line F10; lane 5, non-TG mouse.

