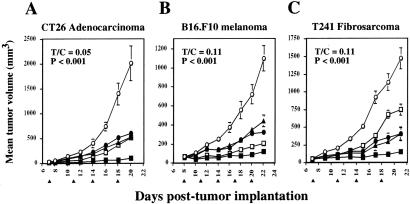
Figure 5.
Effects of the combined treatment of genetically modified CTLs and TNP-470 on tumor growth. (A) CT26 adenocarcinoma cells (5 × 10⁵, n = 4 per group) were implanted s.c. on BALB/c mice. B16.F10 melanoma cells (7 × 10⁵, n = 4 per group) (B) or T241 fibrosarcoma cells (5 × 10⁵, n = 3 per group) (C) were implanted on C57BL/6 mice. On the days indicated with an arrowhead, mice were treated with 5 × 10⁶–10 × 106 VEGF-cTcR CTLs (□), VEGF-cTcR CTLs + TNP-470 (■), MR-1-cTcR CTLs + TNP-470 (▴), PBS + TNP-470 (●), or PBS (○). Mice were treated with TNP-470 every other day and IL-2 every day starting on the first day of CTL therapy. Tumor measurements and analyses were as described for Fig. 4. T/C, ratio of the tumor volumes of the VEGF-cTcR CTL-treated mice to the PBS control mice.

