
FIGURE 7.
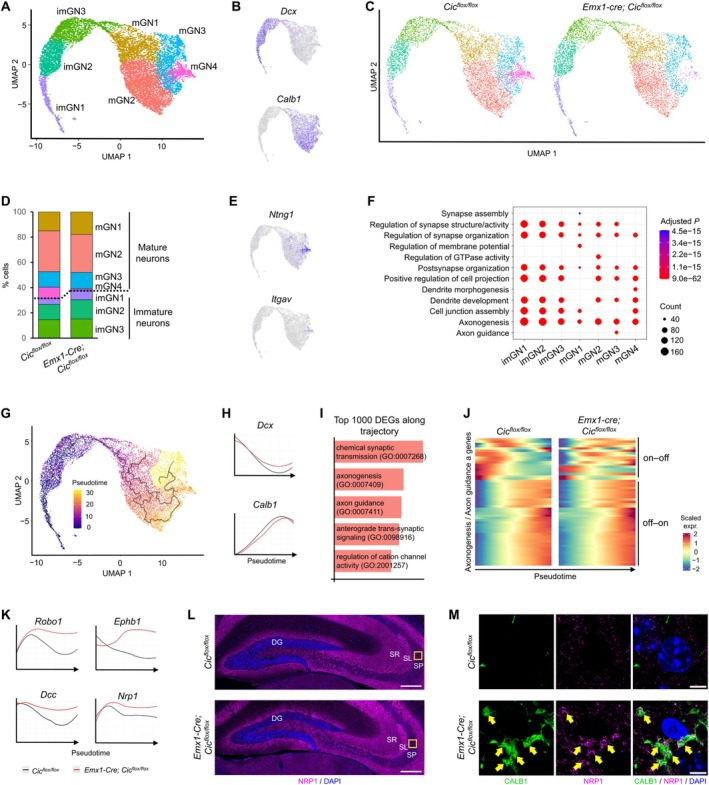
Dysregulation of axonogenesis genes during granule neuron maturation in Emx1‐Cre; Cic flox/flox knockout mice. (A) 2D uniform manifold approximation and projection (UMAP) plot showing seven clusters of granule neurons, including immature (imGN) and mature (mGN) granule neurons. (B) UMAP feature plots illustrating the expression of Dcx and Calb1, markers for immature and mature granule neurons, respectively. (C) UMAP plots comparing the distribution of granule neuron clusters in control (Cic flox/flox ) versus knockout (Emx1‐Cre; Cic flox/flox ) mice. (D) A bar plot showing the proportion of cells within each cluster across the two datasets. (E) UMAP feature plots revealing the expression of Ntng1 and Itgav within the mature neuron cluster mGN4. (F) A dot plot highlighting the top seven gene ontology (GO) terms for differentially expressed genes (DEGs) across all clusters. (G) UMAP plot depicting the maturation trajectory of granule neurons, with cells colored according to pseudotime values. (H) Pseudotime expression plots showing the gene expression profiles of Dcx and Calb1 across the granule neuron maturation trajectory. (I) The top five GO terms associated with the top 1000 DEGs along the granule neuron trajectory in control mice. (J) Heatmap analysis of axonogenesis and axon guidance genes across pseudotime. “On–off” genes refer to those with high expression in immature granule neurons and low expression in mature neurons, while “off–on” genes are highly expressed only in mature granule neurons. (K) Pseudotime expression plots for Robo1, Ephb1, Dcc, and Nrp1, revealing their expression dynamics throughout granule neuron maturation. (L) Representative confocal images showing NRP1 immunostaining in the dentate gyrus (DG) and CA3 region of control and knockout mice. The yellow box denotes the region shown in (M). SL, stratum lucidum; SP, stratum pyramidale; SR, stratum radiatum. Scale bars = 250 μm. (M) Representative confocal images showing co‐labeling (arrows) of mossy fiber terminals with CALB1 and NRP1 in the CA3 SP of knockout mice, but not in control mice. Scale bars = 5 μm.