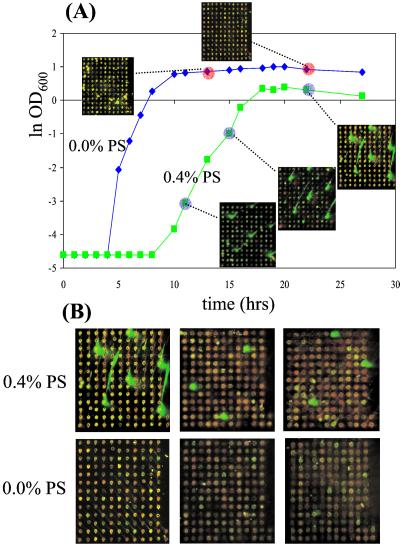
Figure 2.
(A) DNA microarray images from plasmid populations throughout growth in selective and nonselective media (Pine-Sol; PS). The green signals correspond to plasmid samples labeled with Cy3-dUTP, and the red signals correspond to the control genomic DNA labeled with Cy5-dUTP and added in equal proportions to each array. Plasmids with gene inserts, identified by the large green spots on the array, were reproducibly observed in antibiotic-containing cultures and were not enriched in the antibiotic-free cultures. (B) The subarrays shown are representative blocks from the full eight-block (≈1,160 gene probes) array. The patterns of high intensity Cy3 spots in the 0.4% arrays reveal the presence of a selected subpopulation of clones not apparent in the 0.0% samples. Similar patterns of selection were observed in the remaining five blocks. The samples shown are from the last two time points indicated in A.

