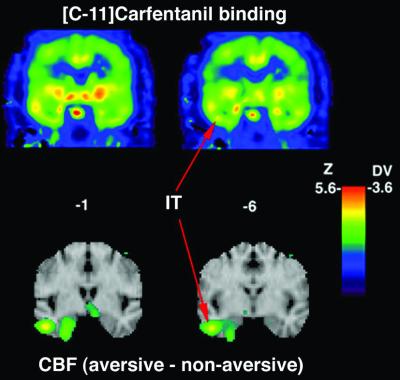
Figure 2.
Activity increases in cortical regions. The figure shows the activity increase for aversive and nonaversive pictures relative to blanks mapped onto surface rendering maps from reference MRI atlas. For each comparison medial view is depicted. The red arrows point to the peak activity in the mPFC. For all comparisons, activation is depicted as Z scores on the color scale, displayed for Z > 1.65

