

ABSTRACT
The butterfly fauna of the megadiverse Republic of India contains 1386 species. The species richness in its 36 federal states and union territories primarily reflects the peculiar geography of the Indian peninsula, which remains unexplored except for patterns influencing species richness. Here, we develop on previous findings by focusing on species identities, by exploring the impact of physical geography, climate, land covers, socioeconomic conditions of the states, patterns by life history traits and shared evolutionary history of butterflies on the presence of individual species per federal state across the Indian peninsula. Physical geography was the strongest predictor of the states' butterfly fauna compositions, followed by climate, land covers and socioeconomics. The main faunal structures separate the humid Northeast from the rest of the country; distinguish humid Western Ghats states from the rest; and group together peninsular mountains. Analysing life histories showed that butterflies of the humid northeastern and southwestern states tend to be larger and develop on woody plants or large grasses; those of arid and high‐altitude states tend to be smaller and develop on small forbs; whereas those utilising broad larval host plant scopes tend to be associated with shrubs and vines and inhabit large geographic ranges. More information on Indian butterflies' life histories would likely yield more intricate insights.
Keywords: faunal structure, functional traits, Lepidoptera, oriental realm, South Asia
The current study examines the butterfly species composition across India's 36 states and territories by utilising an updated checklist and ordination analyses. It incorporates life history traits to provide a deeper ecological understanding. Although India's butterfly fauna has been extensively researched, analyses based on trait composition are a novel approach.

1. Introduction
Fauna of land masses reflect geological history, biotic evolution including speciation, dispersal and extinction and life‐supporting conditions, such as available energy/climate, which determine the biomes/landscape types and vegetation, and ultimately, resources for the animal components of ecosystems (e.g., Williams et al. 2015; Somveille et al. 2018; Rosenberg et al. 2023). The accelerating transformation of ecosystems and novel interactions peculiar to the current Anthropocene epoch (Malhi 2017) represent yet another level of factors influencing the distribution of species.
The monophyletic clade of butterflies (Lepidoptera: Papilionoidea) might represent a richer source of insights into the diversity‐distribution dynamics than birds, perhaps the most popular group in biogeography and macroecology (e.g., Pigot et al. 2018; Storch et al. 2023). Butterflies are similarly species‐rich and easy to record. They are ecologically more homogeneous than birds, although their role in ecosystems is rarely verbalised. While their larvae convey to a general image of diet‐specialised insect herbivores (Janz et al. 2001; Clarke 2022), their adults feed on high‐sugar liquids, including nectar, honeydew, sap and rotting fruit. As rather inefficient pollinators (Wiklund et al. 1979; Bauder et al. 2015; but see Burgin et al. 2023), they exploit plants × pollinators or Hemiptera × ants' interactions (Corke 1999; Gardner‐Gee et al. 2014). As interaction exploiters, butterflies' diversity should follow the complexity of interactions, which is highest in the humid tropics (Trøjelsgaard and Olesen 2013; Forister et al. 2014). The butterfly clade originated in the tropics of the Americas (Kawahara et al. 2023) and displays the highest alpha‐diversity in humid tropical forests (Brown and Freitas 2000; Bonebrake et al. 2010). From them, these interaction exploiters colonised less complex ecosystems.
Yet, detailed knowledge of butterfly faunas and communities exists mainly for those regions of Earth where lepidopterology as a hobby (Salmon et al. 2000) and studies of butterflies as an academic niche (Kudrna 1990) historically evolved: Europe, parts of North America (Scott 1986; Settele et al. 2009), less so Australia, Japan, or South Africa (Braby 2000; Mecenero et al. 2013; Japan Butterfly Conservation Association 2019). This selection includes both regions with long cultural continuity (Europe, Japan) and regions that underwent major ethnocultural transformations (Australia, North America). It is rather uniform, however, in terms of background ecological conditions, as they are mainly situated in temperate bioclimatic zones. From these regions, near‐complete knowledge of life histories of entire butterfly faunas exists (e.g., Baguette and Stevens 2013; Middleton‐Welling et al. 2020; Seifert and Fiedler 2024). The knowledge of life histories, formalised as life history traits' analysis (McGill et al. 2006; de Bello et al. 2021), is instrumental for understanding mechanisms of assemblages' composition and underlying ecosystem processes (Diamond et al. 2011; Slancarova et al. 2016; Wong et al. 2019).
The Republic of India is a megadiverse, prevailingly tropical country with a venerable tradition of butterfly research (Evans 1932; Holloway 1974; Mani 1986), a recent boom in butterfly distribution and ecology studies (e.g., Dar et al. 2022; Dewan et al. 2022; Jambhekar and Driscoll 2023; Naik et al. 2022), and over 1300 butterfly species recorded to date (Das et al. 2023). Belonging to the Indo‐Malayan zoogeography realm, the country displays a complex geography with the World's highest mountains separating it from the Palearctic Realm in the North, southern mountain ranges acting as regional endemism centres, an ocean separating it from other tropical regions, and only narrow conduits towards the rest of the Indo‐Malayan realm in the East and to arid parts of the Palearctic realm in the West. Analysing the species richness of 36 federal states and territories, Das et al. (2023) showed that due to peculiarities of Indian geography, some of the well‐established macroecology patterns, such as the species‐area relationship or latitudinal decrease of species richness, do not hold for this system, whereas topographic diversity and the precipitation/temperature ratio (energy availability) displayed strong effects. As found earlier (Holloway 1974; Kunte 2016; Dewan et al. 2022), humid and forested northeastern states were the species richest, mountainous southwest harboured the highest endemism, and both the core of the peninsula with a more continental climate and the arid northwest were species‐poor.
Species richness, however, is a simplistic description of regional ecological conditions. Exploring the species' composition of regional faunas should bring deeper insights into factors structuring the faunas, especially if studied through the prism of historical traits (Dennis et al. 1998; Kleisner et al. 2012; Soininen et al. 2016). The latter are not yet available for Indian butterflies in the detail typically analysed from temperate regions (Middleton‐Welling et al. 2020), but some life history knowledge is available for all Indian species (cf. Kehimkar 2008; Shirey et al. 2022; Savela 2023), with more detailed knowledge existing for regional faunas (Dewan et al. 2022). Additionally, the patterns of distribution of the majority of species are known at a global level.
Here, we capitalise on the existing knowledge of distribution and life histories of Indian butterflies and use multivariate techniques to disclose the patterns of species composition at the level of federal states and territories. We relate the patterns to predictors characterising the states, namely geography, climate, land covers and current socioeconomic conditions. We then interpret the patterns found by available species traits. Because species ranges and life histories are closely tied to phylogeny, we use phylogeny‐controlled analysis to differentiate between phylogeny‐linked and unlinked patterns.
We target the following hypotheses: (1) Unconstrained ordinations will reveal faunal structures (sensu Dennis et al. 1998) in species co‐occurrence, defined as similarities or dissimilarities among states and regions. (2) These faunal structures should be best interpretable by physical geography, which reflects long‐lasting Earth‐forming processes, and by climate, reflecting energy and resource availability. (3) Measurements of land covers provide a robust but imperfect information on ecosystems composition, while socioeconomic conditions mainly reflect recent processes in human society; socioeconomic predictors should only weakly predict the species compositions. Regarding life history traits, (4) butterfly body size should increase with energy availability and climatic stability. (5) The growth forms of larval host plants should reflect the representation of plant growth forms in the respective biomes. (6) Species with wide global distribution should develop on wider scopes of host plant forms than species utilising narrow scopes of host plant forms.
2. Materials and Methods
2.1. Data Preparation
We used the matrix of all Indian butterfly species and their presences in 36 federal states and union territories (Das et al. 2023; Figure S1) and updated it with more recent records, obtaining a total of 1386 species by April 2024.
Predictors describing individual states (Table 1) developed on those used by Das et al. (2023) in the study of species richness patterns. The six geography predictors were the cardinal coordinates of the states' centroids, their average altitude, their areas, and the difference between highest and lowest altitude viewed as a measure of topographic and habitat heterogeneity. For climate, we used the 19 bioclimatic variables (WorldClim 2024), from CHELSA v.1.2 with 2.5 min spatial resolution (Karger et al. 2017), extracted and averaged for the areas within the federal states' boundaries. For land covers, we used 24 statistics describing the conditions in Indian federal states, extracted using satellite imagery and provided by Bhuvan LULC 15–16 (Bhuvan 2023). The six socioeconomic variables (population density, urban population, rural population, literacy rate, gross domestic product per capita and total livestock) were publicly available statistics describing the conditions of individual states, extracted from Das et al. (2023).
TABLE 1.
Overview of the predictors used to analyse the distribution of 1386 butterfly species recorded in 36 federal states and union territories of the Republic of India. The predictors marked as * and ** are compound predictors, obtained by PCA analyses of Climate and Land covers predictors, respectively (see Figures S2 and S3 for details).
| Variables | Description | Unit | Variables | Description | Unit |
|---|---|---|---|---|---|
| Geography | Land covers | ||||
| x | Centroid latitude | DD | Cr | Crop land | sq. km. |
| y | Centroid longitude | DD | Sh | Current shifting cultivation | sq. km. |
| z min | Minimum altitude | m | Fa | Fallow | sq. km. |
| z max | Maximum altitude | m | Pl | Plantation | sq. km. |
| z | Mean altitude | m | Ba | Barren rocky | sq. km. |
| Area | Area of the state | sq. km. | Gu | Gullied/Ravinous | sq. km. |
| AltDiff | Altitude difference (z max – z min) | m | Ra | Rann | sq. km. |
| Climate | Sa | Salt affected land | sq. km. | ||
| bio1 | Annual mean temperature | SD | Sandy area | sq. km. | |
| bio2 | Mean diurnal range (mean of monthly (max temp – min temp)) | ScL | Scrub land | sq. km. | |
| Mi | Mining | sq. km. | |||
| bio3 | Isothermality (bio2/bio7) (×100) | Ru | Rural | sq. km. | |
| bio4 | Temperature aeasonality (standard deviation ×100) | °C | Ur | Urban | sq. km. |
| De | Deciduous | sq. km. | |||
| bio5 | Max temperature of warmest month | °C | Ev | Evergreen/Semi Evergreen | sq. km. |
| bio6 | Min temperature of coldest month | °C | FoP | Forest plantation | sq. km. |
| bio7 | Temperature annual range (bio5‐bio6) | °C | ScF | Scrub forest | sq. km. |
| bio8 | Mean temperature of wettest quarter | °C | Sw | Swamp/Mangrove | sq. km. |
| bio9 | Mean temperature of driest quarter | °C | Gr | Grass/grazing land | sq. km. |
| bio10 | Mean temperature of warmest quarter | °C | Sn | Snow | sq. km. |
| bio11 | Mean temperature of coldest quarter | °C | InW | Inland wetland | sq. km. |
| bio12 | Annual precipitation | mm | CoW | Coastal wetland | sq. km. |
| bio13 | Precipitation of wettest month | mm | Ri | River/stream/canals | sq. km. |
| bio14 | Precipitation of driest month | mm | WaB | Waterbodies | sq. km. |
| bio15 | Precipitation seasonality (coefficient of variation) | mm | Land1** | Land cover PCA axis 1 | |
| Land2** | Land cover PCA axis 2 | ||||
| bio16 | Precipitation of wettest quarter | mm | Land3** | Land cover PCA axis 3 | |
| bio17 | Precipitation of driest quarter | mm | Land4** | Land cover PCA axis 4 | |
| bio18 | Precipitation of warmest quarter | mm | Socioeconomics | ||
| bio19 | Precipitation of coldest quarter | mm | HumPopDens | Population density | sq. km. |
| Climate1* | Climate PCA axis 1 | UrPop | Urban population | % | |
| Climate2* | Climate PCA axis 2 | RuPop | Rural population | % | |
| Climate3* | Climate PCA axis 3 | LitRate | Literacy rate | % | |
| Climate4* | Climate PCA axis 4 | GDPpercap | Gross domestic product per Capita | USD | |
| Livestock | Total Livestock | million | |||
To obtain information on butterfly life histories, we tabularised for all species the following information: (i) wing span (numeric, mm) as a simple measure of body size, potentially related to adult mobility (Sekar 2012), but also to development length and host plants' defences (Bartonova et al. 2014); (ii) larval host plant growth form (categorical, distinguishing forbs, grasses, tall grasses, shrubs, climbers/vines, trees and ants‐dependent/carnivorous), which is straightforwardly linked to habitat use (Jain et al. 2017) and to host plants' defences and butterfly voltinism (Altermatt 2010a); (iii) larval plants' forms scope (numeric), obtained as a simple sum of larval host plant growth forms, assuming that broader dietary range links to more generalised resource use (Shreeve et al. 2001; Vanreusel and Van Dyck 2007); (iv) distribution range in India, defined as the number of states with positive occurrence (numeric, 1–36); (v) global distribution range (ordinal at 1–5 scale, where 1—particular region, ideally smaller than the area of India, 2—size of India, 3—greater than India but smaller than Indo‐Malayan realm, 4—greater than Indo‐Malayan realm or size of a continent, 5—Cosmopolitan). For missing values (n = 464, i.e., 3.04% of the 15,246 cells of the traits' matrix, all related to host plant forms), we used arithmetic means of relevant columns of the table. Note that (iv + v) does not represent life history traits in a strict sense but convey information on niche breadth and potential distribution areas (Alzate and Onstein 2022; Dewan et al. 2022; Hausharter et al. 2023).
Because species are not independent units but share phyletic histories, relations between life history traits and their distributions should be constrained by phylogeny in analyses (Harvey and Pagel 1991; Seifert and Fiedler 2024). We used the phylogeny tree and its list of all butterflies from Kawahara et al. (2023). From this, we manually selected all the genera distributed in India and removed the remaining genera using the ‘keep.tip’ function from the R package ape (Paradis and Schliep 2019). The genera not included in the phylogeny tree were added to the closest proximate node manually by following available individual phylogeny using the function ‘bind.tip’. Species not represented in the tree (n = 1094) were added to the roots of their respective genera using the ‘add.species.to.genus’ (R package phytools) (Revell 2024), while species not occurring in India were removed from the Indian genera root by utilising the ‘drop.tip’ function. See Table S1 for the final species list.
2.2. Data Analyses
Prior to analyses, we transformed all predictors describing individual states to zero means and unit variances to facilitate mutual comparability of their effects. Species data per individual states entered the analyses in 1/0 form. The analyses were carried out in CANOCO v.5.1 (ter Braak and Smilauer 2018). Significances of constrained ordinations were assessed using 999 Monte Carlo permutations.
We first subjected the 19 climate and 24 land cover predictors to two separate principal component analyses (PCA) centred on the variables, with the 36 states treated as samples. The obtained principal components describing the variation of climate and land cover across Indian federal states were used in subsequent analyses (Figures S2 and S3).
Second, to visualise similarities of butterfly faunas of individual states, we run PCA (centred by species), again with the 36 states as samples and respective species' lists as response variables. Third, we computed four constrained linear redundancy analyses (RDA) based on geography, climate, land cover and socioeconomic predictors (including second‐order interactions and quadratic functions in case of geography coordinates), selecting appropriate combinations of predictors via the CANOCO forward selection procedure. We then used the selected terms of the constrained ordinations as covariables in partial unconstrained (pPCA) and partial constrained (pRDA) analyses used to quantify mutual effects of the four groups of predictors on the pattern in species distribution.
Finally, we interpreted the PCAs and RDAs derived patterns by life history traits. We used the fourth‐corner approach (Legendre et al. 1997; Dray and Legendre 2008), which relates results of ordinations of two tables (here, states × species) to a third table (the traits). Technically, this was done via two‐step ordinations, explaining axes from the previous PCA and RDA analyses by the traits using RDAs with 999 Monte‐Carlo permutations.
To investigate the effects of phylogeny on the axes–trait patterns, we used the phylogeny tree to generate a square dissimilarities matrix (in R, using the function ‘cophenetic.phylo’) and subjected it to the principal coordinate analysis (PCO) in CANOCO. These generated 1386 PCO vectors, by which we constrained the RDA results, manually selecting only PCO vectors explaining > 2.0% of variation in the species occurrences data. We then interpreted the thus constrained RDA axes by life history traits, as in analyses not constrained by phylogeny.
3. Results
The unconstrained PCA relating butterflies to federal states revealed prominent geography patterns (Figure 1). The first principal component (eig 0.389) separated humid monsoon northeastern states from the rest; the second component (eig 0.121) separated the southern peninsular states from those in the Himalayan North of the peninsula; the third (eig 0.088) distinguished Himalayan and southern mountainous (Western Ghats) states from both the northeast and interior of the peninsula, while the fourth (eig 0.040) accounted for only a minor part of the variation.
FIGURE 1.

Visualisation of results of PCA analysis, relating occurrences of 1386 butterfly species recorded from the 36 federal states and union territories of the Republic of India. Intensity of colours is proportional to values of loadings at the 1st–4th PCA axes.
The partial pPCAs indicated that geography had overwhelming effects on the distribution of butterflies, explaining 62% of variation in the data. This was followed by climate (36%), land covers (29%) and socioeconomics (18%) (Table 2). Visualising the results showed that with geography as covariables, the relationships among states completely dissipated, whereas in the models controlled for climate, land covers and socioeconomics, the basic patterns (northeast vs. the rest, Himalayas vs. the rest) remained preserved (Figure S4).
TABLE 2.
Results of unconstrained (PCA) and constrained (RDA) ordinations explaining the butterfly species composition at the level of 36 federal states and union territories of the Republic of India. The combinations of geography, climate, land covers and socioeconomics predictors were obtained by forward selection procedures, the same combinations were used in partial ordinations as covariables (notified as ‘|’ in the table). The models marked by ‘+’ were used in subsequent third‐order analyses with life history traits (Table 3).
| Model | Model structure | Varadj | Eig1 | Eig2 | Eig3 | Eig4 | F p axis1 | F p all axes |
|---|---|---|---|---|---|---|---|---|
| Unconstrained (PCA)+ | ~ | 0.389 | 0.121 | 0.088 | 0.040 | |||
| ~|Geography | ~|x + y + x*y + x*z + y*z + y 2 + z 2 + AltDiff | 62.1 | 0.074 | 0.048 | 0.031 | 0.024 | ||
| ~|Climate | ~|Climate1 + Climate2 + Climate3 | 36.3 | 0.158 | 0.073 | 0.064 | 0.036 | ||
| ~|Land covers | ~|Land1 + Land3 | 29.6 | 0.187 | 0.106 | 0.064 | 0.036 | ||
| ~|Socioeconomics | ~|Rural population + Livestock | 18.4 | 0.258 | 0.108 | 0.079 | 0.038 | ||
| Geography RDA+ | x + y + x*y + x*z + y*z + y 2 + z 2 + AltDiff | 50.9 | 0.338 | 0.095 | 0.079 | 0.032 | 1.7*** | 5.5*** |
| ~|Climate | y + x*z + y*z + z 2 + AltDiff|Climate | 26.1 | 0.107 | 0.054 | 0.038 | 0.026 | 1.1*** | 3.3*** |
| ~|Land covers | x + y + x*y + x*z + y*z + y 2 + z 2 + AltDiff|Land covers | 37.5 | 0.143 | 0.076 | 0.057 | 0.027 | 0.8*** | 3.5*** |
| ~|Socioeconomics | x + y + x*y + x*z + y*z + y 2 + z 2 + AltDiff|Socioeconomics | 42.0 | 0.210 | 0.078 | 0.071 | 0.029 | 1.1*** | 4.0*** |
| Climate RDA+ | Climate1 + Climate2 + Climate3 | 30.3 | 0.281 | 0.063 | 0.018 | — | 4.2*** | 6.1*** |
| ~|Geography | –|Geography | — | — | — | — | — | — | — |
| ~|Land covers | Climate1 + Climate2 + Climate3|Land1 + Land3 | 18.3 | 0.111 | 0.047 | 0.023 | — | 1.9*** | 3.5*** |
| ~|Socioeconomics | Climate1 + Climate2|Socioeconomics | 20.2 | 0.157 | 0.047 | — | — | 3.7*** | 5.2*** |
| Land covers RDA+ | Land1 + Land3 | 25.4 | 0.230 | 0.066 | — | — | 4.9*** | 6.9*** |
| ~|Geography | Land3|Geography | 03.9 | 0.028 | — | — | — | 2.1** | — |
| ~|Climate | Land1 + Land3|Climate | 12.5 | 0.071 | 0.043 | — | — | 1.9** | 3.3*** |
| ~|Socioeconomics | Land1 + Land3 | Socioeconomics | 15.1 | 0.112 | 0.054 | — | — | 2.5*** | 3.9*** |
| Socioeconomics RDA+ | Rural population + Livestock | 13.5 | 0.160 | 0.025 | — | — | 3.1** | 3.7** |
| ~|Geography | –|Geography | — | — | — | — | — | — | — |
| ~|Climate | –|Climate | — | — | — | — | — | — | — |
| ~|Land covers | –|Land covers | — | — | — | — | — | — | — |
Note: Monte‐Carlo permutation tests significance values: **p < 0.01, ***p < 0.001.
The constrained RDA ordinations (Table 2, Figure 2) corroborated that the strongest predictor of per‐state butterfly species composition was geography, followed by climate, land covers and socioeconomics. Consequently, controlling climate, land covers and socioeconomics models by geography resulted in non‐significant models. Climate, however, retained some independent effects if controlled by land covers and socioeconomics; land covers retained a weak independent effect if controlled by climate and socioeconomics, and socioeconomics did not sustain controls by other sets of predictors.
FIGURE 2.
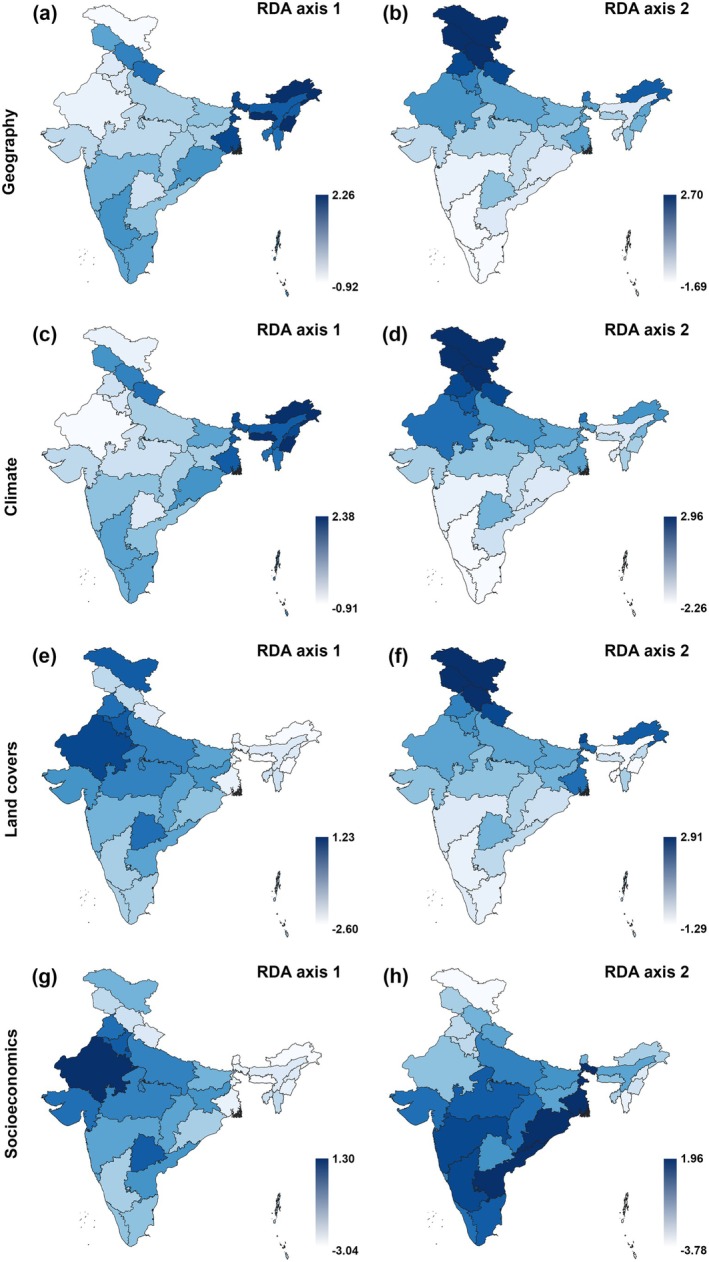
Visualisation of results of the (constrained) RDA analyses, relating occurrences of 1386 butterfly species recorded from the 36 federal states and union territories of the Republic of India to geography, climate, land covers and socioeconomics. See Table 2 for terms of the ordination models and relevant statistics. Intensity of colours is proportional to values of loadings at the 1st and 2nd RDA axes of each model.
Interpreting the ordination results by life history traits (Table 3) revealed that in unconstrained analysis, large‐bodied butterflies developing on trees, climbers or tall grasses inclined towards northeastern states (Figure 3a). Such butterflies also tend to have wide distributions across the Old World tropics. Species developing on shrubs or having wide host plant scope inclined towards southern mountainous states. Finally, small‐bodied species developing on grasses and forbs inclined towards mountainous states. The patterns obtained by interpreting the geography model were very similar (Figure 3b). The patterns for climate again showed the association of large‐bodied butterflies with development on climbers, trees, tall grasses, and shrubs, and the association of all these traits related to monsoon climates with high precipitation and high temperatures around the Indian Peninsula. Such butterflies also inhabit large distribution ranges globally and occur in many Indian federal states. Small‐bodied butterflies developing on forbs or short grasses displayed the opposite patterns, that is, an association with high temperatures and precipitation (Figure 3c). For land covers, the large‐bodied butterflies associated with tall grasses inclined towards states containing coastal croplands. They also inhabit large ranges. In contrast, high representation of forests was associated with development on shrubs, trees, climbers and occurrence in many Indian states. Small butterflies developing on forbs were situated oppositely to any trees in mountainous states (Figure 3d). Interpreting the socioeconomics ordination was most puzzling, as it produced a very strong first ordination axis (cf. Table 3), parallel with high rural population and high livestock. These conditions were associated with wide host plant scopes, feeding on shrubs, distribution in many Indian states, relatively small wing spans and rather wide global ranges. The much weaker second ordination axis ran in parallel with low rural population and high livestock, conditions typical for sparsely populated arid areas. Here, a high representation of small‐bodied butterflies develops on forbs or grasses. The large‐bodied butterflies, typically feeding on tall grasses, were most represented in states with low rural population and low livestock, that is, in the densely forested states (Figure 3e).
TABLE 3.
Statistical properties of RDA models, using third‐corner approach to relate the ordination axes from models relating the distribution of 1386 butterfly species in 36 Indian federal states and union territories to predictors describing the states (summarised in Table 2), to life history traits of the butterflies. The models are visualised at Figures 3 and 4.
| Model | Varadj | Eig1 | Eig2 | Eig3 | Eig4 | F p axis1 | F p all axes |
|---|---|---|---|---|---|---|---|
| Ignoring phylogeny | |||||||
| Unconstrained (PCA) | 18.0 | 0.101 | 0.062 | 0.013 | 0.008 | 15.5*** | 31.3*** |
| Geography RDA | 22.4 | 0.156 | 0.061 | 0.010 | 0.002 | 25.3*** | 40.9*** |
| Climate RDA | 23.7 | 0.156 | 0.074 | 0.013 | — | 25.4*** | 44.1*** |
| Land covers RDA | 22.6 | 0.203 | 0.029 | — | — | 34.9*** | 41.4*** |
| Socioeconomics | 29.6 | 0.265 | 0.036 | — | — | 49.6*** | 59.1*** |
| Considering phylogeny | |||||||
| Unconstrained (PCA) | 11.1 | 0.056 | 0.012 | 0.005 | 0.003 | 12.0*** | 16.8*** |
| Geography RDA | 13.0 | 0.065 | 0.007 | 0.004 | 0.001 | 16.2*** | 19.8*** |
| Climate RDA | 10.5 | 0.047 | 0.011 | 0.004 | 0.002 | 11.3*** | 15.8*** |
| Land covers RDA | 11.2 | 0.048 | 0.009 | 0.002 | 0.001 | 12.8*** | 16.3*** |
| Socioeconomics RDA | 17.7 | 0.088 | 0.014 | 0.005 | 0.001 | 22.2*** | 28.3*** |
Note: Monte‐Carlo permutation tests significance values: **p < 0.01, ***p < 0.001.
FIGURE 3.

Ordination diagrams obtained by the third‐corner analyses (axes 1st and 2nd), using RDA to relate the ordination axes (blue darts) from unconstrained PCA (a) and constrained RDA analyses (constrained by b: geography, c: climate, d: land covers, e: socioeconomics), to life history traits (grey darts) of the butterfly species recorded in the 36 federal states and union territories of the Republic of India. See Tables 2 and 3 for the relevant statistics. Traits abbreviations: Ca/My, carnivorous/ants‐dependent or Myrmecophily; Cl, climbers/vines; Fr, (larval development on) forbs; Glo, global range; Gr, grasses; Hp_scope, larval host plants scope; Ind, Indian distribution range; Shr, shrubs; tGr, tall grasses; Tr, trees; Ws, wing span.
The models considering butterfly phylogeny explained much lower amounts of variation than the models ignoring it (Table 3). The difference in explained variation between the models ignoring and considering phylogeny was highest for socioeconomics, implying that patterns of butterfly distribution explicable by socioeconomic conditions were the least phylogeny dependent. Interpreting the models by traits dissolved the associations between body size, feeding on trees and global distribution, while retaining the associations between feeding on shrubs and climbers with a high number of host plant forms (Figure 4a). The link among global distribution, the number of inhabited Indian states, and the number of host plant forms was retained in the analysis constrained by geography (Figure 4b), while body size lost the association with feeding on trees, implying a strong phylogenetic dependency of large bodies with development on tree foliage. The patterns were almost identical in analyses with climate, land cover and socioeconomics (Figure 4c–e).
FIGURE 4.

Ordination diagrams obtained by the butterfly phylogeny constrained third‐corner analyses (axes 1st and 2nd), using RDA to relate the ordination axes from unconstrained PCA (a) and constrained RDAs (constrained by b: geography, c: climate, d: land covers, e: socioeconomics), to life history traits of the butterfly species recorded in the 36 federal states and union territories of the Republic of India. Only the relationships among traits (grey darts) are shown. See Tables 2 and 3 for the relevant statistics. Traits abbreviation: Ca/My, carnivorous/ants‐dependent or Myrmecophily; Cl, climbers/vines; Fr, (larval development on) forbs; Glo, global range; Gr, grasses; Hp_scope, larval host plants scope; Ind, Indian distribution range; Shr, shrubs; tGr, tall grasses; Tr, trees; Ws, wing span.
4. Discussion
Using multivariate analysis to explore the distributional patterns of butterfly species at the level of 36 federal states and territories forming the Republic of India, we found a significant effect of geography, which explained over 60% of the variation in the analysis constrained by geographic predictors. Climate, land covers and socioeconomic characteristics of the federal states had less significant explanatory effects and were closely tied to geography. The patterns of species distribution were attributable to their life histories. Large‐bodied species inclined towards northeastern states with a warm and humid monsoon climate, dense forests and low representation of the rural population around the Indian Peninsula. The growth forms of larval host plants reflected a broad distribution of plant growth forms in the main biomes of India. Larval development on trees, climbers and tall grasses corresponded with occurrence in states situated in the humid forest biome, and development on forbs and grasses with states containing arid or alpine biomes. The scope of larval host plant forms used by individual species increased with feeding on shrubs and climbers, and butterflies with broad host plant form scopes inhabited high numbers of federal states and displayed wide global distributions. Despite the still limited information on the life histories of Indian butterflies, species' traits were linked to their ecology and distribution.
The significant geography effect and existence of geographically linked faunal structures were previously observed by Holloway (1974), who used the best numeric method available at his time, a cluster analysis on a selection of butterfly genera. Das et al. (2023) developed this approach in their analysis of butterfly species counts across Indian federal states. The results presented here corroborate the earlier findings using species identities.
The effect of geographic predictors is attributable to the peculiar geography of the Indian peninsula, which affected the phyletic history of Indian taxa. In the Cretaceous period, when the basal radiation of Papilionoidea occurred in Gondwanan South America, Australia and the eastern parts of the Northern continent (Kawahara et al. 2023), the Indian peninsula was a large island, gradually drifting northwards after the breakup of Gondwana. Not too high diversity of indigenous lineages is expectable on islands (MacArthur and Wilson 1967) and the diversity was possibly affected by late‐Cretaceous catastrophic volcanism of the Deccan traps (cf. Wellman and McElhinny 1970; Schoene et al. 2015). Later, the colonisation of the current peninsula by butterfly lineages occurred mainly from the archipelagos now forming the eastern part of the Indo‐Malayan zoogeographic realm, which communicated with both Australian and East‐Palearctic regions (cf. Kawahara et al. 2023). The peninsular India, however, had been and remains relatively isolated from the eastern parts of the Indo‐Malayan region. Only a narrow conduit formed by the Garo‐Rajmahal gap in present‐day Bangladesh connects it with more easterly tropical areas (Tiwari and Jassal 2001; Das et al. 2023), while the Himalayas block the communication with the Palearctic (Mani 1986). The colonisation from Africa, via transoceanic transfers or overland, had always been restricted (Kodandaramaiah and Wahlberg 2007; Irungbam et al. 2023). Consequently, the fauna of the federal states east of the Garo‐Rajmahal gap is richer than the fauna of peninsular India (Holloway 1974; Kunte et al. 2012). A notable exception is the Western Ghats states in SW India, which form a secondary speciation and endemism centre (Gaonkar 1996; Kunte 2016), but also display increased representation of afro‐tropical species (Das et al. 2023).
Climatic patterns are fundamentally governed by geography, which is evident from the effects of coasts and major mountain ranges on monsoons (Lu et al. 2020; Chauhan et al. 2023), or from differences in vegetation between windward and leeward mountain slopes (Pepin et al. 2017). Climate, however, directly affects the eco‐physiological tolerance of insects (Sinclair et al. 2003; Vrba et al. 2017). Das et al. (2023) showed that per‐state richness of Indian butterflies reflects the available energy, in agreement with various taxa from across the world (e.g., Wright 1983; Hawkins and Porter 2003; Carrara and Vázquez 2010; Duncan et al. 2015). The two main climatic connections influencing the species composition of Indian states' faunas are that connecting the mountainous and humid northeast with northwestern Himalayan and western Ghats states (shared species, e.g., Celastrina lavendularis, Neptis nata), and that connecting the trans‐Himalayan Ladakh with sparsely forested arid states of NW peninsula and central Deccan (e.g., Gegenes nostradamus, Belenois aurota).
In agreement with our original prediction, land covers and socioeconomic predictors executed weaker influences on the composition of Indian states' faunas, and even their influences reflected underlying effects of geography (e.g., low forest cover in the high mountainous Ladakh) or climate (e.g., the high livestock numbers in the arid Rajasthan, the warm and humid densely forested northeastern states). Consequently, the land covers produced ordinations very similar to climate and geography, whereas the analysis based on socioeconomic predictors produced completely different patterns, decoupled from the geography‐based faunal structures. Recall that the weak effect of socioeconomic predictors relates to areas of entire states; it might become much stronger at finer scales, as suggested by studies of urbanisation effects on insects (Diamond et al. 2023).
Given incomplete knowledge of life histories of many Indian species (cf. Shirey et al. 2022), we tabularised only a few readily available traits. Still, the distribution of the traits in federal states' faunas reflected highly significantly the predictors describing the states. The most easily available trait, the wing span (a body size proxy), increased towards northeastern states, and the climate, land covers and socioeconomics models all agreed that forests of Indian northeast host the largest butterflies. Indeed, some of the largest species of Indian fauna are either restricted to northeastern states (e.g., Atrophaneura aidoneus, Papilio paradoxa, Stichophtalma sparta), or occur there and in other humid forested regions (e.g., Troides aeacus, Byasa dasarada, Papilio arcturus). By supplement, small‐bodied butterflies were associated with mountainous and/or northwestern states, including the trans‐Himalayan Ladakh. Some of the smallest Indian butterflies are restricted to the latter (e.g., Turanana chitrali, Agriades pheretiades, Pyrgus alpinus), which does not exclude the presence of some small species in tropical peninsular India (e.g., Freyeria putli, Zizula hylax, Spialia galba).
The debate on the geographic distribution of butterfly (or Lepidoptera) body sizes has long been obscured by inconsistent results from different continents and clades, suggesting effects of phyletic history (Barlow 1994; Hawkins and Lawton 1995). A trade‐off exists between body size and development speed, and hence the number of generations (Seifert et al. 2023). In high latitudes, lepidopteran body size—voltinism relationships are restricted by season length, available temperatures and the ecosystems' net primary productivity (Huston and Wolverton 2011; Zeuss et al. 2017). Similar constraints likely restrict butterfly body size in mountainous or arid regions, including those of India. In the highly productive rainforest states (cf. Das et al. 2023), the presence of large‐sized butterflies is fully expected.
In ordinations of species traits, large wingspan corresponded with development on tall grasses (i.e., bamboos of the genera Bambusa, Dendrocalamus, Saccharum), climbers (e.g., Aristolochia, Cynanchum, Vincetoxicum) and trees, whereas small wingspan corresponded with development on small grasses and forbs. This appears linked to prevailing land covers in the respective states (humid forests in the northeastern, Himalayan slopes and Western Ghats states; grasslands in arid northwest and trans‐Himalayan Ladakh). It does not explain, however, why the rainforest butterflies tend to grow large, rather than staying small and forming multiple generations. Young plant tissues are more palatable for young herbivorous insect larvae than old tissues (Cizek 2005). Then, development on woody plants requires that the larvae start feeding on fresh foliage, which constraints the numbers of insect generations while favouring larger final size (Cizek et al. 2006; Altermatt 2010b; Seifert et al. 2023). Hatada and Matsumoto (2007) observed that larval development of the papilionid Luehdorfia japonica was longer on old than young leaves. Because availability of young plant tissues is seasonally less predictable in humid tropics than in seasonal regions, the herbivores, including butterflies, may be selected for larger body size, and hence the ability to develop on older tissues. The relationships between development length, body size and voltinism are further linked to the plants' antiherbivore defences (Smilanich et al. 2016), which remain little explored in the tropics (but see Endara et al. 2017; Segar et al. 2024).
Host plant scope, expressed here as the number of host plant growth forms utilised per species, was related to larval development on shrubs, climbers and less so trees and tall grasses, but not small grasses and forbs. Notably, some genera of Indian flora contain trees, shrubs and climbers (e.g., Morinda, Ficus), but not forbs and small grasses. This implies that the basic distinction between species developing on small/unapparent and qualitatively protected plants, typically forbs, versus large/apparent and quantitatively protected plants, that is, trees, shrubs and tall grasses (Feeny 1976), exists in Indian butterfly fauna. The host plant scope as used by us might also be related to taxonomic trophic range (i.e., the number of host species), and hence to niche breadth and commonness vs. rarity. Such relationships are unlikely straightforward, as common but strictly monophagous butterflies exist, for example, in the Palearctic (cf. Bryant et al. 1997). Still, broad host plant scope is positively linked to latitudinal range size in Europe (Seifert and Fiedler 2024). The wide host scope was also collinear with the number of Indian states inhabited, suggesting that such butterflies inhabit many federal states, including species‐poor central peninsular areas and small coastal territories. It was also collinear with wide global distribution. Indian butterflies displaying these trait combinations include such widespread pantropical species as Hypolimnas missipus, Lampides boeticus or Eurema blanda.
In analyses controlled for phylogeny, the relationship between large body size and feeding on trees or tall grasses dissipated. This reflects the existence of species‐rich clades, whose members are similar in size and conserved in associations with certain host plant forms. Examples at the large‐bodied side include Graphium or Euthalia developing on trees (22 and 20 species in India, respectively); Byasa and Euploea developing on vines (7 and 12 species) or Lethe developing on tall grasses (42 species). At the small‐bodied side, Heliophorus (12 species) and Jamides (8 species) all develop on small forbs.
In contrast, the positive relationships between the number of host plant forms, numbers of Indian states and global distribution were independent of phylogeny, suggesting that broad larval trophic ranges covary with wide distributions independently of the phylogeny of such successful taxa.
To conclude, we demonstrated that analysing factors affecting regional species compositions is possible for tropical faunas even at a relatively crude level of political units, such as Indian federal states and territories. Geography crucially affects the composition of regional faunas, and interpretation of the faunal compositions by life history traits revealed intriguing patterns. The number of traits analysed, however, was severely restricted by still incomplete knowledge of life histories of many of the Indian species. Therefore, much work aiming to decipher detailed ecological requirements of individual species is needed.
Author Contributions
Gaurab Nandi Das: conceptualization (equal), data curation (lead), formal analysis (equal), methodology (equal), visualization (equal), writing – original draft (equal). Zdenek Faltynek Fric: conceptualization (equal), formal analysis (equal), methodology (equal), visualization (equal), writing – review and editing (equal). Martin Konvicka: conceptualization (equal), formal analysis (equal), methodology (equal), supervision (lead), visualization (equal), writing – original draft (equal), writing – review and editing (equal).
Conflicts of Interest
The authors declare no conflicts of interest.
Supporting information
Data S1: ece372217‐sup‐0001‐DataS1.docx.
Acknowledgements
We thank Prof. Petr Smilauer for his comments on formal analysis, Swapna Devi Ray for her assistance during preliminary data compilation, and Matthew Sweney for language checking. The study was funded by the Grant Agency of the University of South Bohemia, grant number 100/2022/P.
Das, G. N. , Fric Z. F., and Konvicka M.. 2025. “Geography of Life Histories in a Tropical Fauna: The Case of Indian Butterflies.” Ecology and Evolution 15, no. 9: e72217. 10.1002/ece3.72217.
Funding: The study was funded by the Grant Agency of the University of South Bohemia (grant number 100/2022/P).
Data Availability Statement
This study used species distribution data available in ‘Dryad’ at https://doi.org/10.5061/dryad.mpg4f4r9r.
References
- Altermatt, F. 2010a. “Climatic Warming Increases Voltinism in European Butterflies and Moths.” Proceedings of the Royal Society B: Biological Sciences 277: 1281–1287. 10.1098/rspb.2009.1910. [DOI] [PMC free article] [PubMed] [Google Scholar]
- Altermatt, F. 2010b. “Tell Me What You Eat and I'll Tell You When You Fly: Diet Can Predict Phenological Changes in Response to Climate Change.” Ecology Letters 13: 1475–1484. 10.1111/j.1461-0248.2010.01534.x. [DOI] [PubMed] [Google Scholar]
- Alzate, A. , and Onstein R. E.. 2022. “Understanding the Relationship Between Dispersal and Range Size.” Ecology Letters 25: 2303–2323. 10.1111/ele.14089. [DOI] [PubMed] [Google Scholar]
- Baguette, M. , and Stevens V. M.. 2013. “Predicting Minimum Area Requirements of Butterflies Using Life‐History Traits.” Journal of Insect Conservation 17: 645–652. 10.1007/s10841-013-9548-x. [DOI] [Google Scholar]
- Barlow, N. D. 1994. “Size Distributions of Butterfly Species and the Effect of Latitude on Species Sizes.” Oikos 71: 326–332. 10.2307/3546281. [DOI] [Google Scholar]
- Bartonova, A. , Benes J., and Konvicka M.. 2014. “Generalist‐Specialist Continuum and Life History Traits of Central European Butterflies (Lepidoptera)—Are We Missing a Part of the Picture?” European Journal of Entomology 111: 543–553. 10.14411/eje.2014.060. [DOI] [Google Scholar]
- Bauder, J. A. S. , Warren A. D., and Krenn H. W.. 2015. “The Ecological Role of Extremely Long‐Proboscid Neotropical Butterflies (Lepidoptera: Hesperiidae) in Plant‐Pollinator Networks.” Arthropod‐Plant Interactions 9: 415–424. 10.1007/s11829-015-9379-7. [DOI] [Google Scholar]
- Bhuvan . 2023. “Bhuvan, Indian Geo Platform of ISRO, National Remote Sensing Centre, Indian Space Research Organisation.” http://bhuvan.nrsc.gov.in/.
- Bonebrake, T. C. , Ponisio L. C., Boggs C. L., and Ehrlich P. R.. 2010. “More Than Just Indicators: A Review of Tropical Butterfly Ecology and Conservation.” Biological Conservation 143: 1831–1841. 10.1016/j.biocon.2010.04.044. [DOI] [Google Scholar]
- Braby, M. F. 2000. Butterflies of Australia: Their Identification, Biology and Distribution, Vols 1 and 2. CSIRO Publishing. [Google Scholar]
- Brown, K. S., Jr. , and Freitas A. V. L.. 2000. “Atlantic Forest Butterflies: Indicators for Landscape Conservation.” Biotropica 32: 934–956. 10.1111/j.1744-7429.2000.tb00631.x. [DOI] [Google Scholar]
- Bryant, S. R. , Thomas C. D., and Bale J. S.. 1997. “Nettle‐Feeding Nymphalid Butterflies: Temperature, Development and Distribution.” Ecological Entomology 22: 390–398. 10.1046/j.1365-2311.1997.00082.x. [DOI] [Google Scholar]
- Burgin, G. A. , Bronzo‐Munich O., Garner A. G., Acevedo I. A., and Hopkins R.. 2023. “Characterizing Each Step of Pollination in Phlox drummondii Reveals That a Single Butterfly Species Predominates in the Pollinator Assemblage.” American Journal of Botany 110: e16172. 10.1002/ajb2.16172. [DOI] [PubMed] [Google Scholar]
- Carrara, R. , and Vázquez D. P.. 2010. “The Species–Energy Theory: A Role for Energy Variability.” Ecography 33: 942–948. 10.1111/j.1600-0587.2009.05756.x. [DOI] [Google Scholar]
- Chauhan, H. K. , Gallacher D., Bhatt A., and Bisht A. K.. 2023. “The Himalayas: A Climate Change Laboratory.” Environmental Development 45: 100814. 10.1016/j.envdev.2023.100814. [DOI] [Google Scholar]
- Cizek, L. 2005. “Diet Composition and Body Size in Insect Herbivores: Why Do Small Species Prefer Young Leaves?” European Journal of Entomology 102: 675. 10.14411/eje.2005.096. [DOI] [Google Scholar]
- Cizek, L. , Fric Z., and Konvicka M.. 2006. “Host Plant Defences and Voltinism in European Butterflies.” Ecological Entomology 31: 337–344. 10.1111/j.1365-2311.2006.00783.x. [DOI] [Google Scholar]
- Clarke, H. E. 2022. “A Provisional Checklist of European Butterfly Larval Foodplants.” Nota Lepidopterologica 45: 139–167. 10.3897/nl.45.72017. [DOI] [Google Scholar]
- Corke, D. 1999. “Are Honeydew/Sap‐Feeding Butterflies (Lepidoptera: Rhopalocera) Affected by Particulate Air‐Pollution?” Journal of Insect Conservation 3: 5–14. 10.1023/A:1009670404398. [DOI] [Google Scholar]
- Dar, A. A. , Jamal K., Shah M. S., et al. 2022. “Species Richness, Abundance, Distributional Pattern and Trait Composition of Butterfly Assemblage Change Along an Altitudinal Gradient in the Gulmarg Region of Jammu & Kashmir, India.” Saudi Journal of Biological Sciences 29: 2262–2269. 10.1016/j.sjbs.2021.11.066. [DOI] [PMC free article] [PubMed] [Google Scholar]
- Das, G. N. , Fric Z. F., Panthee S., Irungbam J. S., and Konvicka M.. 2023. “Geography of Indian Butterflies: Patterns Revealed by Checklists of Federal States.” Insects 14, no. 6: 549. 10.3390/insects14060549. [DOI] [PMC free article] [PubMed] [Google Scholar]
- de Bello, F. , Lavorel S., Hallett L. M., et al. 2021. “Functional Trait Effects on Ecosystem Stability: Assembling the Jigsaw Puzzle.” Trends in Ecology & Evolution 36: 822–836. 10.1016/j.tree.2021.05.001. [DOI] [PubMed] [Google Scholar]
- Dennis, R. L. , Williams W. R., and Shreeve T. G.. 1998. “Faunal Structures Among European Butterflies: Evolutionary Implications of Bias for Geography, Endemism and Taxonomic Affiliation.” Ecography 21: 181–203. 10.1111/j.1600-0587.1998.tb00672.x. [DOI] [Google Scholar]
- Dewan, S. , Sanders N. J., and Acharya B. K.. 2022. “Turnover in Butterfly Communities and Traits Along an Elevational Gradient in the Eastern Himalaya, India.” Ecosphere 13: e3984. 10.1002/ecs2.3984. [DOI] [Google Scholar]
- Diamond, S. E. , Bellino G., and Deme G. G.. 2023. “Urban Insect Bioarks of the 21st Century.” Current Opinion in Insect Science 57: 101028. 10.1016/j.cois.2023.101028. [DOI] [PubMed] [Google Scholar]
- Diamond, S. E. , Frame A. M., Martin R. A., and Buckley L. B.. 2011. “Species' Traits Predict Phenological Responses to Climate Change in Butterflies.” Ecology 92: 1005–1012. 10.1890/10-1594.1. [DOI] [PubMed] [Google Scholar]
- Dray, S. , and Legendre P.. 2008. “Testing the Species Traits‐Environment Relationships: The Fourth‐Corner Problem Revisited.” Ecology 89: 3400–3412. 10.1890/08-0349.1. [DOI] [PubMed] [Google Scholar]
- Duncan, C. , Chauvenet A. L., Brown M. E., and Pettorelli N.. 2015. “Energy Availability, Spatio‐Temporal Variability and Implications for Animal Ecology.” Diversity and Distributions 21: 290–301. 10.1111/ddi.12270. [DOI] [Google Scholar]
- Endara, M. J. , Coley P. D., Ghabash G., et al. 2017. “Coevolutionary Arms Race Versus Host Defense Chase in a Tropical Herbivore–Plant System.” Proceedings of the National Academy of Sciences of the United States of America 114: E7499–E7505. 10.1073/pnas.1707727114. [DOI] [PMC free article] [PubMed] [Google Scholar]
- Evans, W. H. 1932. The Identification of Indian Butterflies. 2nd Revised ed. Bombay Natural History Society. [Google Scholar]
- Feeny, P. 1976. “Plant Apparency and Chemical Defense.” In Biochemical Interaction Between Plants and Insects. Recent Advances in Phytochemistry, vol. 10, edited by Wallace J. W. and Mansell R. L., 1–40. Springer. [Google Scholar]
- Forister, M. L. , Novotny V., Panorska A. K., et al. 2014. “The Global Distribution of Diet Breadth in Insect Herbivores.” Proceedings of the National Academy of Sciences of the United States of America 112: 442–447. 10.1073/pnas.1423042112. [DOI] [PMC free article] [PubMed] [Google Scholar]
- Gaonkar, H. 1996. Butterflies of the Western Ghats, India (Including Sri Lanka: A Biodiversity Assessment of a Threatened Mountain System). Indian Institute of Sciences. [Google Scholar]
- Gardner‐Gee, R. , Dhami M. K., Paulin K. J., and Beggs J. R.. 2014. “Can Alternative Sugar Sources Buffer Pollinators From Nectar Shortages?” Environmental Entomology 43: 1514–1525. 10.1603/EN13292. [DOI] [PubMed] [Google Scholar]
- Harvey, P. H. , and Pagel M. D.. 1991. The Comparative Method in Evolutionary Biology. Oxford University Press. [Google Scholar]
- Hatada, A. , and Matsumoto K.. 2007. “Survivorship and Growth in the Larvae of Luehdorfia japonica Feeding on Old Leaves of Asarum megacalyx .” Entomological Science 10: 307–314. 10.1111/j.1479-8298.2007.00227.x. [DOI] [Google Scholar]
- Hausharter, J. , Rashid S., Wessely J., et al. 2023. “Niche Breadth Explains the Range Size of European‐Centred Butterflies, but Dispersal Ability Does Not.” Global Ecology and Biogeography 32: 1535–1548. 10.1111/geb.13717. [DOI] [PMC free article] [PubMed] [Google Scholar]
- Hawkins, B. A. , and Lawton J. H.. 1995. “Latitudinal Gradients in Butterfly Body Sizes ‐ Is There a General Pattern.” Oecologia 102: 31–36. [DOI] [PubMed] [Google Scholar]
- Hawkins, B. A. , and Porter E. E.. 2003. “Water–Energy Balance and the Geographic Pattern of Species Richness of Western Palearctic Butterflies.” Ecological Entomology 28: 678–686. 10.1111/j.1365-2311.2003.00551.x. [DOI] [Google Scholar]
- Holloway, J. D. 1974. “The Biogeography of Indian Butterflies.” In Ecology and Biogeography in India, edited by Mani M. S., 473–499. Monographiae Biologicae. [Google Scholar]
- Huston, M. A. , and Wolverton S.. 2011. “Regulation of Animal Size by eNPP, Bergmann's Rule, and Related Phenomena.” Ecological Monographs 81: 349–405. 10.1890/10-1523.1. [DOI] [Google Scholar]
- Irungbam, M. , Irungbam J. S., Rindos M., Maresova J. P., and Fric Z. F.. 2023. “Phylogeography of the Small Grass Yellow Eurema brigitta (Stoll, 1780) (Lepidoptera: Pieridae) Unveils the Existence of Distinct Taxa Within the Palaeotropics.” Austral Entomology 62: 410–417. 10.1111/aen.12665. [DOI] [Google Scholar]
- Jain, A. , Lim F. K., and Webb E. L.. 2017. “Species‐Habitat Relationships and Ecological Correlates of Butterfly Abundance in a Transformed Tropical Landscape.” Biotropica 49: 355–364. 10.1111/btp.12435. [DOI] [Google Scholar]
- Jambhekar, R. , and Driscoll D. A.. 2023. “Species Traits Help Explain Butterfly Habitat Use in a Tropical Forest.” Ecological Entomology 48: 199–208. 10.1111/een.13215. [DOI] [Google Scholar]
- Janz, N. , Nyblom K., and Nylin S.. 2001. “Evolutionary Dynamics of Host‐Plant Specialization: A Case Study of the Tribe Nymphalini.” Evolution 55: 783–796. 10.1554/0014-3820(2001)055[0783:EDOHPS]2.0.CO;2. [DOI] [PubMed] [Google Scholar]
- Japan Butterfly Conservation Association . 2019. Field Guide to the Butterflies of Japan. Seibundo Shinkosha. [Google Scholar]
- Karger, D. N. , Conrad O., Böhner J., et al. 2017. “Climatologies at High Resolution for the Earth's Land Surface Areas.” Scientific Data 4: 170122. 10.1038/sdata.2017.122. [DOI] [PMC free article] [PubMed] [Google Scholar]
- Kawahara, A. Y. , Storer C., Carvalho A. P. S., et al. 2023. “A Global Phylogeny of Butterflies Reveals Their Evolutionary History, Ancestral Hosts and Biogeographic Origins.” Nature Ecology & Evolution 7: 903–913. 10.1038/s41559-023-02041-9. [DOI] [PMC free article] [PubMed] [Google Scholar]
- Kehimkar, K. 2008. The Book of Indian Butterflies. Bombay Natural History Society. [Google Scholar]
- Kleisner, K. , Keil P., and Jaros F.. 2012. “Biogeography of Elytral Ornaments in Palearctic Genus Carabus: Disentangling the Effects of Space, Evolution and Environment at a Continental Scale.” Evolutionary Ecology 26: 1025–1040. 10.1007/s10682-011-9537-z. [DOI] [Google Scholar]
- Kodandaramaiah, U. , and Wahlberg N.. 2007. “Out‐Of‐Africa Origin and Dispersal‐Mediated Diversification of the Butterfly Genus Junonia (Nymphalidae: Nymphalinae).” Journal of Evolutionary Biology 20: 2181–2191. 10.1111/j.1420-9101.2007.01425.x. [DOI] [PubMed] [Google Scholar]
- Kudrna, O. 1990. Introduction to Lepidopterology. Butterflies of Europe, vol. 2. Aula Verlag. [Google Scholar]
- Kunte, K. 2016. “Biogeographic Origins and Habitat Use of the Butterflies of the Western Ghats.” In Invertebrate Diversity and Conservation in the Western Ghats, India, edited by Priyadarsanan D. M., Devy M. S., Subramanian K. A., Aravind N. A., and Seena N. K., 1–21. Ashoka Trust for Research in Ecology and the Environment. [Google Scholar]
- Kunte, K. , Sondhi S., Sangma B. M., Lovalekar R., Tokekar K., and Agavekar G.. 2012. “Butterflies of the Garo Hills of Meghalaya, Northeastern India: Their Diversity and Conservation.” Journal of Threatened Taxa 4: 2933–2992. 10.11609/JoTT.o2945.2933-92. [DOI] [Google Scholar]
- Legendre, P. , Galzin R., and Harmelin‐Vivien M. L.. 1997. “Relating Behavior to Habitat: Solutions to the Fourth‐Corner Problem.” Ecology 78: 547–562. 10.1890/0012-9658(1997)078[0547:RBTHST]2.0.CO;2. [DOI] [Google Scholar]
- Lu, H. , Liu R., Cheng L., et al. 2020. “Phased Evolution and Variation of the South Asian Monsoon, and Resulting Weathering and Surface Erosion in the Himalaya–Karakoram Mountains, Since Late Pliocene Time Using Data From Arabian Sea Core.” Geological Magazine 157: 864–878. 10.1017/S0016756820000291. [DOI] [Google Scholar]
- MacArthur, R. H. , and Wilson E. O.. 1967. The Theory of Island Biogeography. Princeton University Press. [Google Scholar]
- Malhi, Y. 2017. “The Concept of the Anthropocene.” Annual Review of Environment and Resources 42: 77–104. 10.1146/annurev-environ-102016-060854. [DOI] [Google Scholar]
- Mani, M. S. 1986. Butterflies of the Himalaya. Springer. [Google Scholar]
- McGill, B. J. , Enquist B. J., Weiher E., and Westoby M.. 2006. “Rebuilding Community Ecology From Functional Traits.” Trends in Ecology & Evolution 21: 178–185. 10.1016/j.tree.2006.02.002. [DOI] [PubMed] [Google Scholar]
- Mecenero, S. , Ball J. B., D. A., Edge. 2013. Conservation Assessment of Butterflies of South Africa, Lesotho and Swaziland: Red List and Atlas. Saftronics (Pty) Ltd. & Animal Demography Unit. [Google Scholar]
- Middleton‐Welling, J. , Dapporto L., Garcia‐Barros E., et al. 2020. “A New Comprehensive Trait Database of European and Maghreb Butterflies, Papilionoidea.” Scientific Data 7: 351. 10.1038/s41597-020-00697-7. [DOI] [PMC free article] [PubMed] [Google Scholar]
- Naik, D. , Rao R. S. P., Kunte K., and Mustak M. S.. 2022. “Ecological Monitoring and Indicator Taxa: Butterfly Communities in Heterogeneous Landscapes of the Western Ghats and Malabar Coast, India.” Journal of Insect Conservation 26: 107–119. [Google Scholar]
- Paradis, E. , and Schliep K.. 2019. “Ape 5.0: An Environment for Modern Phylogenetics and Evolutionary Analyses in R.” Bioinformatics 35: 526–528. 10.1093/bioinformatics/bty633. [DOI] [PubMed] [Google Scholar]
- Pepin, N. C. , Pike G., Schaefer M., Boston C. M., and Lovell H.. 2017. “A Comparison of Simultaneous Temperature and Humidity Observations From the SW and NE Slopes of Kilimanjaro: The Role of Slope Aspect and Differential Land‐Cover in Controlling Mountain Climate.” Global and Planetary Change 157: 244–258. 10.1016/j.gloplacha.2017.08.006. [DOI] [Google Scholar]
- Pigot, A. L. , Jetz W., Sheard C., and Tobias J. A.. 2018. “The Macroecological Dynamics of Species Coexistence in Birds.” Nature Ecology & Evolution 2: 1112–1119. 10.1038/s41559-018-0572-9. [DOI] [PubMed] [Google Scholar]
- Revell, L. J. 2024. “Phytools 2.0: An Updated R Ecosystem for Phylogenetic Comparative Methods (and Other Things).” PeerJ 12: e16505. 10.7717/peerj.16505. [DOI] [PMC free article] [PubMed] [Google Scholar]
- Rosenberg, Y. , Bar‐On Y. M., Fromm A., et al. 2023. “The Global Biomass and Number of Terrestrial Arthropods.” Science Advances 9: eabq4049. 10.1126/sciadv.abq4049. [DOI] [PMC free article] [PubMed] [Google Scholar]
- Salmon, M. A. , Marren P., and Harley B.. 2000. The Aurelian Legacy: British Butterflies and Their Collectors. University of California Press. [Google Scholar]
- Savela, M. 2023. “Ditrysia Börner, 1925.” https://www.nic.funet.fi/pub/sci/bio/life/insecta/lepidoptera/ditrysia/.
- Schoene, B. , Samperton K. M., Eddy M. P., et al. 2015. “U‐Pb Geochronology of the Deccan Traps and Relation to the End‐Cretaceous Mass Extinction.” Science 347: 182–184. 10.1126/science.aaa0118. [DOI] [PubMed] [Google Scholar]
- Scott, J. A. 1986. The Butterflies of North America: A Natural History and Field Guide. Stanford University Press. [Google Scholar]
- Segar, S. T. , Re Jorge L., Nicholls L., et al. 2024. “Species Swarms and Their Caterpillar Colonisers: Phylogeny and Polyphenols Determine Host Plant Specificity in New Guinean Lepidoptera.” Frontiers in Ecology and Evolution 11: 1308608. 10.3389/fevo.2023.1308608. [DOI] [Google Scholar]
- Seifert, C. L. , and Fiedler K.. 2024. “Macroecological Patterns in European Butterflies Unveil Strong Interrelations Between Larval Diet Breadth, Latitudinal Range Size and Voltinism.” Ecography 2024: e07021. 10.1111/ecog.07021. [DOI] [Google Scholar]
- Seifert, C. L. , Strutzenberger P., and Fiedler K.. 2023. “How Do Host Plant Use and Seasonal Life Cycle Relate to Insect Body Size: A Case Study on European Geometrid Moths (Lepidoptera: Geometridae).” Journal of Evolutionary Biology 36: 743–752. 10.1111/jeb.14169. [DOI] [PubMed] [Google Scholar]
- Sekar, S. 2012. “A Meta‐Analysis of the Traits Affecting Dispersal Ability in Butterflies: Can Wingspan Be Used as a Proxy?” Journal of Animal Ecology 81: 174–184. 10.1111/j.1365-2656.2011.01909.x. [DOI] [PubMed] [Google Scholar]
- Settele, J. , Shreeve T., Konvicka M., and Dyck H. V.. 2009. Ecology of Butterflies in Europe. Cambridge University Press. [Google Scholar]
- Shirey, V. , Larsen E., Doherty A., et al. 2022. “Lep Traits 1.0: Butterfly Traits 1.0: A Globally Comprehensive Dataset of Butterfly Traits.” Scientific Data 9: 382. 10.1038/s41597-022-01473-5. [DOI] [PMC free article] [PubMed] [Google Scholar]
- Shreeve, T. G. , Dennis R. L. H., Roy D. B., and Moss D.. 2001. “An Ecological Classification of British Butterflies: Ecological Attributes and Biotope Occupancy.” Journal of Insect Conservation 5: 145–161. 10.1023/A:1017556113534. [DOI] [Google Scholar]
- Sinclair, B. J. , Addo‐Bediako A., and Chown S. L.. 2003. “Climatic Variability and the Evolution of Insect Freeze Tolerance.” Biological Reviews 78: 181–195. 10.1017/S1464793102006024. [DOI] [PubMed] [Google Scholar]
- Slancarova, J. , Bartonova A., Zapletal M., et al. 2016. “Life History Traits Reflect Changes in Mediterranean Butterfly Communities due to Forest Encroachment.” PLoS One 11: e0152026. 10.1371/journal.pone.0152026. [DOI] [PMC free article] [PubMed] [Google Scholar]
- Smilanich, A. M. , Fincher R. M., and Dyer L. A.. 2016. “Does Plant Apparency Matter? Thirty Years of Data Provide Limited Support but Reveal Clear Patterns of the Effects of Plant Chemistry on Herbivores.” New Phytologist 210: 1044–1057. 10.1111/nph.13875. [DOI] [PubMed] [Google Scholar]
- Soininen, J. , Jamoneau A., Rosebery J., and Passy S. I.. 2016. “Global Patterns and Drivers of Species and Trait Composition in Diatoms.” Global Ecology and Biogeography 25: 940–950. 10.1111/geb.12452. [DOI] [Google Scholar]
- Somveille, M. , Rodrigues A. S. L., and Manica A.. 2018. “Energy Efficiency Drives the Global Seasonal Distribution of Birds.” Nature Ecology & Evolution 2: 962–969. 10.1038/s41559-018-0556-9. [DOI] [PubMed] [Google Scholar]
- Storch, D. , Kolecek J., Keil P., Vermouzek Z., Vorisek P., and Reif J.. 2023. “Decomposing Trends in Bird Populations: Climate, Life Histories and Habitat Affect Different Aspects of Population Change.” Diversity and Distributions 29: 572–585. 10.1111/ddi.13682. [DOI] [Google Scholar]
- ter Braak, C. J. F. , and Smilauer P.. 2018. Canoco Reference Manual and User's Guide: Software for Ordination (Version 5.1). Microcomputer Power. [Google Scholar]
- Tiwari, S. , and Jassal G. S.. 2001. “Origin and Evolution of the Garo‐Rajmahal Gap.” Journal of the Geological Society of India 57: 389–403. [Google Scholar]
- Trøjelsgaard, K. , and Olesen J. M.. 2013. “Macroecology of Pollination Networks.” Global Ecology and Biogeography 22: 149–162. 10.1111/j.1466-8238.2012.00777.x. [DOI] [Google Scholar]
- Vanreusel, W. , and Van Dyck H.. 2007. “When Functional Habitat Does Not Match Vegetation Types: A Resource‐Based Approach to Map Butterfly Habitat.” Biological Conservation 135: 202–211. 10.1016/j.biocon.2006.10.035. [DOI] [Google Scholar]
- Vrba, P. , Nedved O., Zahradnickova H., and Konvicka M.. 2017. “More Complex Than Expected: Cold Hardiness and the Concentration of Cryoprotectants in Overwintering Larvae of Five Erebia Butterflies (Lepidoptera: Nymphalidae).” European Journal of Entomology 114: 470–480. 10.14411/eje.2017.060. [DOI] [Google Scholar]
- Wellman, P. , and McElhinny M.. 1970. “K–Ar Age of the Deccan Traps, India.” Nature 227: 595–596. 10.1038/227595a0. [DOI] [PubMed] [Google Scholar]
- Wiklund, C. , Eriksson T., and Lundberg H.. 1979. “The Wood White Butterfly Leptidea sinapis and Its Nectar Plants: A Case of Mutualism or Parasitism?” Oikos 33: 358–362. 10.2307/3544323. [DOI] [Google Scholar]
- Williams, M. , Zalasiewicz J., Haff P. K., Schwägerl C., Barnosky A. D., and Ellis E. C.. 2015. “The Anthropocene Biosphere.” Anthropocene Review 2: 196–219. 10.1177/2053019615591020. [DOI] [Google Scholar]
- Wong, M. K. , Guénard B., and Lewis O. T.. 2019. “Trait‐Based Ecology of Terrestrial Arthropods.” Biological Reviews 94: 999–1022. 10.1111/brv.12488. [DOI] [PMC free article] [PubMed] [Google Scholar]
- WorldClim . 2024. Bioclimatic Variables, WorldClim. https://www.worldclim.org/data/bioclim.html.
- Wright, D. H. 1983. “Species‐Energy Theory: An Extension of Species‐Area Theory.” Oikos 41: 496–506. 10.2307/3544109. [DOI] [Google Scholar]
- Zeuss, D. , Brunzel S., and Brandl R.. 2017. “Environmental Drivers of Voltinism and Body Size in Insect Assemblages Across Europe.” Global Ecology and Biogeography 26: 154–165. 10.1111/geb.12525. [DOI] [Google Scholar]
Associated Data
This section collects any data citations, data availability statements, or supplementary materials included in this article.
Supplementary Materials
Data S1: ece372217‐sup‐0001‐DataS1.docx.
Data Availability Statement
This study used species distribution data available in ‘Dryad’ at https://doi.org/10.5061/dryad.mpg4f4r9r.