
FIGURE 2.
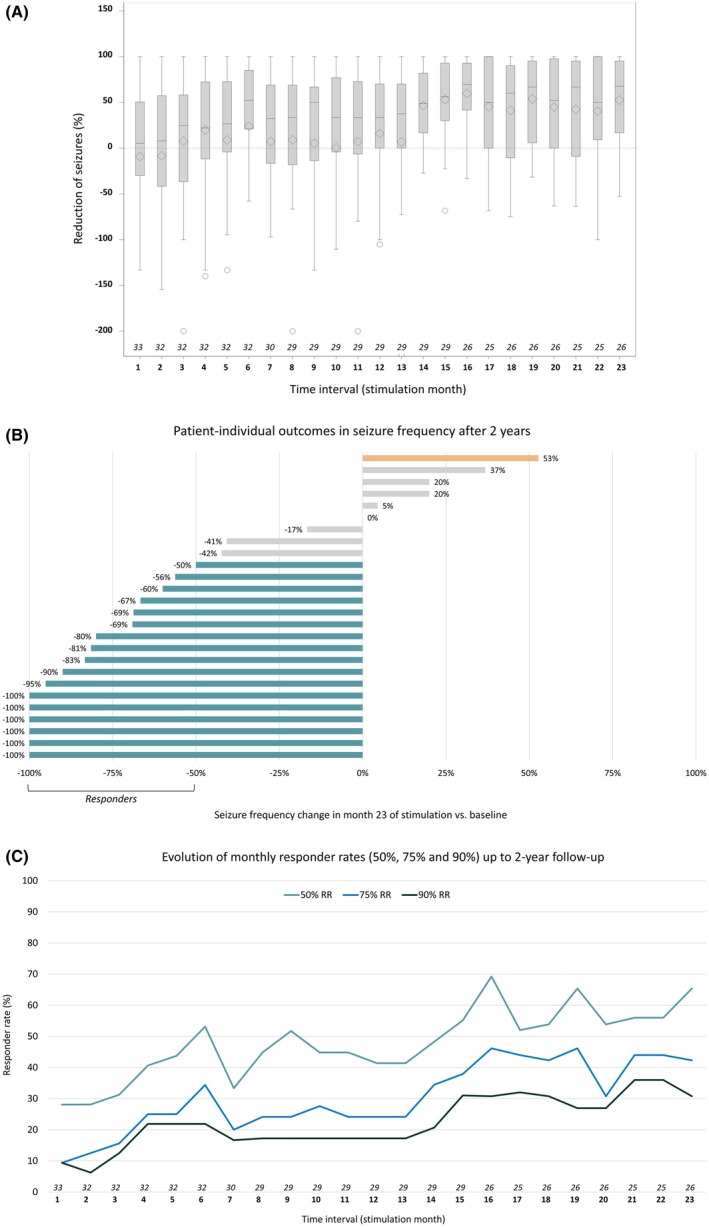
(A) Box plots with mean (diamond) and median (horizontal line in plot) seizure frequency reduction and spread for 2 years following device implantation given per stimulation month (stimulation was generally turned on 1 month after implantation). Note that months without reliable seizure counts in patients´ diaries are considered missing, as reflected by the number given for each month. (B) Patient‐individual outcomes at 2‐year follow‐up for the 26 patients with seizure diary data available (cf. panel A). Responders with at least 50% seizure reduction are depicted in blue, the one patient with >50% seizure increase in orange. (C) Development of treatment response over time (percentage of patients with 50%, 75%, and 90% seizure reduction) over time. RR, responder rate.