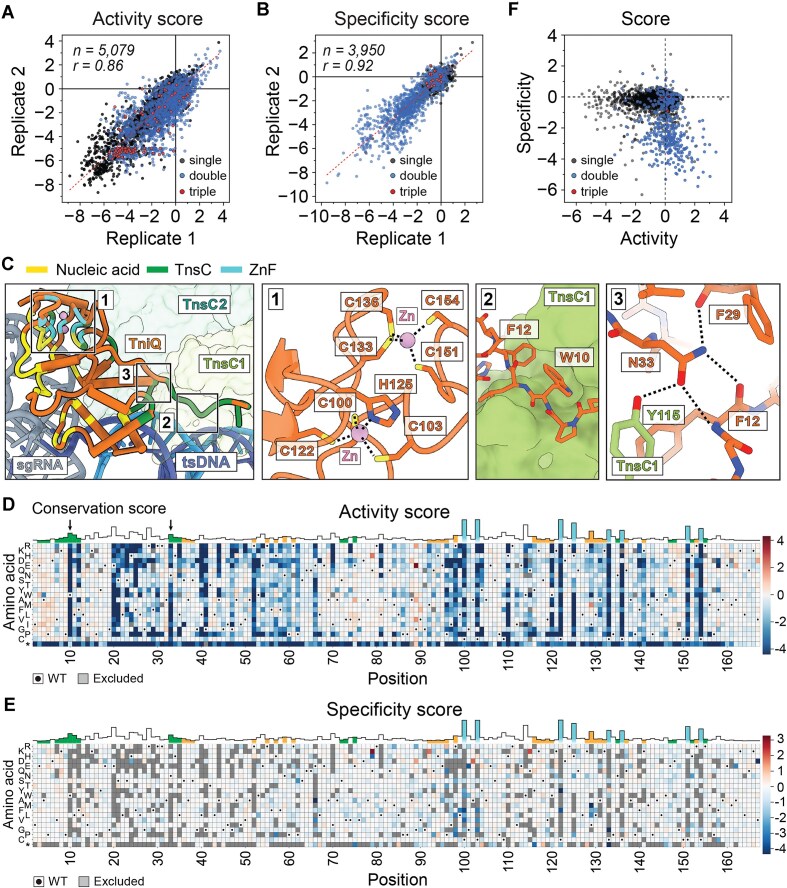
Figure 4.
TniQ mutagenesis reveals a rich landscape and opportunities to improve integration activity with multiple mutations. (A) Activity and (B) specificity scores from two biological replicates are shown as scatter plots. Each dot on the scatter plot represents an individual TniQ variant, with different colors indicating single (black), double (blue), or triple mutants (red). n = number of observed variants; r = Pearson coefficient. Red dotted line indicates linear regression fit. (C) TniQ interactions with Zn (cyan), TnsC (green), and nucleic acids (yellow) are functionally categorized and highlighted on the structure (PDB: 8RDU). TnsC promoters (shades of green) are numbered starting from the one closest to TniQ (orange). tsDNA indicates target-strand DNA (blue), and sgRNA is colored gray. Regions for the close-up view are indicated with numbered boxes. Insets depicting structural details are shown to the right; dotted lines indicate strong non-covalent interactions. Zinc ion is shown as a pink sphere, and positions shown in sticks are colored according to their functional groups: carbon (orange), oxygen (red), nitrogen (blue), and sulfur (yellow). Heatmaps of (D) activity and (E) specificity scores of TniQ single mutants. Each mutation (y-axis) at each residue (x-axis) is represented by a color scale based on enrichment scores. Stop codon is labeled with an asterisk (*). Red colors indicate positive scores, white indicates near 0, and blue indicates negative scores. WT amino acid is indicated with a dot, and gray boxes indicate data that were excluded due to insufficient read counts or absence from the library. Conservation scores at each position are also shown at the top, with the color scheme defined in panel (C). In panel (D), W10 and N33 are indicated by black arrows. (F) Scatter plot shows a correlation between activity and specificity scores of TniQ mutants. Variants with both activity and specificity score values are plotted. Interactive versions of the heatmaps, scatter plots, and raw data are provided in supplementary materials.

