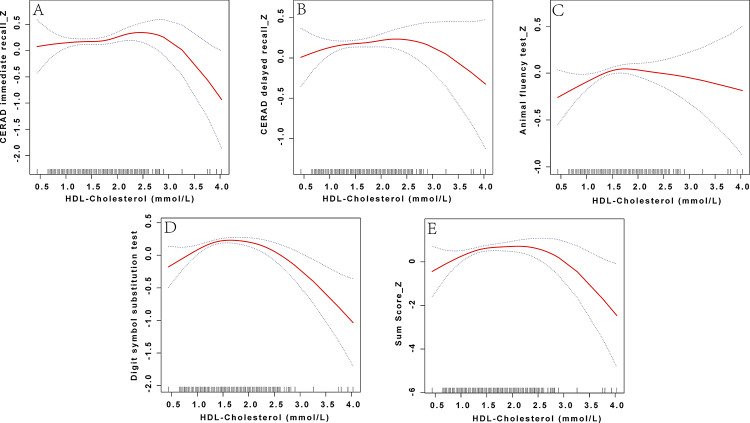
Fig. 3.
Restricted cubic spline curve depicting the relationship between HDL-C and cognitive function in females. HDL-C levels were compared with the Z-scores of four cognitive function tests: CERAD immediate recall (CERAD immediate recall_Z), CERAD delayed recall (CERAD delayed recall_Z), Animal Fluency Test (Animal Fluency Test_Z), Digit Symbol Substitution Test (Digit Symbol Substitution Test_Z), and the composite cognitive score (Sum_Score_Z). Non-linear associations were modeled using restricted cubic splines within generalized additive models, adjusting for age, race/ethnicity, education level, LDL-C, TG, total cholesterol, HbA1c, PIR, BMI, medical history, marital status, physical activity, alcohol use, lipid-lowering drugs use, and smoking status

