
FIGURE 5.
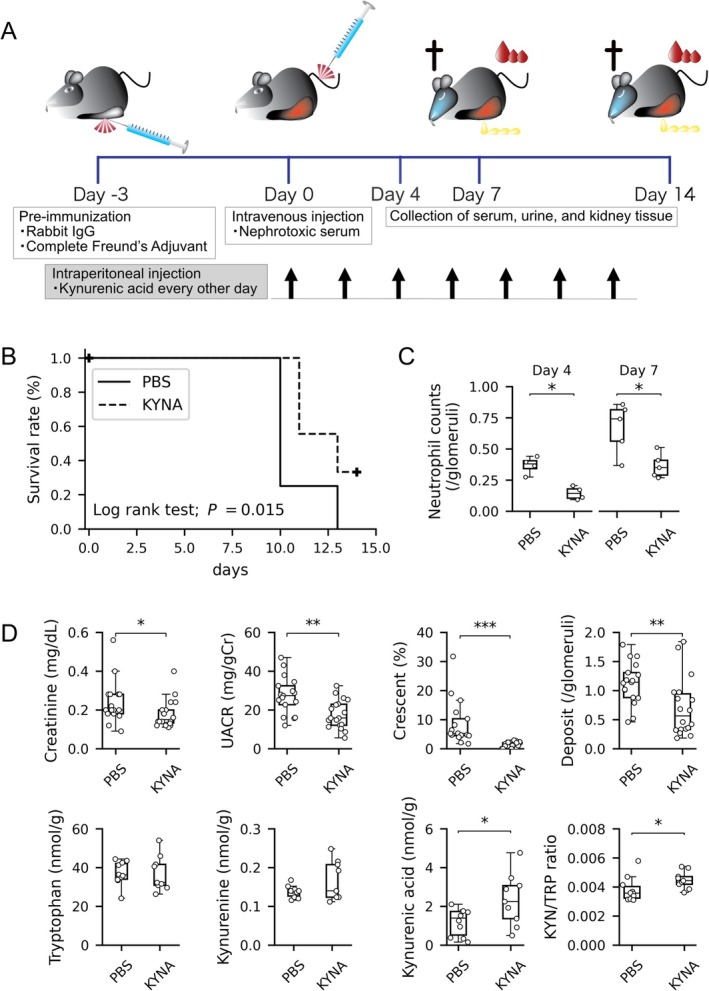
Effect of KYNA administration in Ido1‐deficient mice with NTS‐GN. (A) Experimental timeline for KYNA administration in the NTS‐GN model. KYNA or PBS was administered intraperitoneally every other day into Ido1‐deficient mice. (B) Kaplan–Meier survival curves for KYNA‐treated (dashed line, n = 9) and phosphate‐buffered saline (PBS)‐treated (solid line, n = 8) Ido1‐deficient mice. KYNA treatment significantly improved survival (log‐rank test, p = 0.015). (C) Quantification of glomerular neutrophil infiltration on days 4 and 7. Neutrophil counts were significantly decreased in Ido1‐deficient mice with KYNA injection on days 4 and 7 compared with PBS‐treated control (p = 0.029 and p = 0.032, respectively, Mann–Whitney U test). n = 4 for each group at day 4 and n = 5 at day 7. (D) Box plots showing therapeutic effects of KYNA on kidney injury (top row: Serum creatinine, UACR, crescent formation rate, PAS‐positive deposit scores; n = 16–18 per group) and on tryptophan metabolism in the kidney cortex (bottom row: TRP, KYN, KYNA, and KYN/TRP ratio; n = 9–10 per group) at day 7. KYNA‐treated mice showed significantly improved renal parameters and increased KYNA and KYN/TRP ratio (p = 0.046 and p = 0.031, respectively; Mann–Whitney U test; p < 0.05 for all significant comparisons). Asterisks (*, **, ***) indicate statistically significant differences (p < 0.05, p < 0.01, p < 0.001, respectively).