
Figure 3.
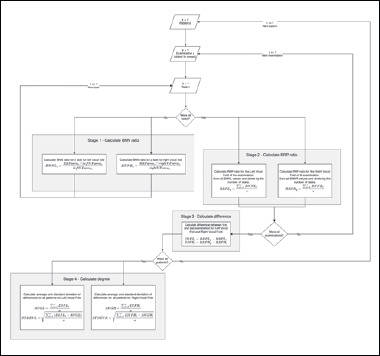
Diagram of the algorithm that calculates the degree of change of the papilloma coverage area located on the vocal folds.
Official websites use .gov
A
.gov website belongs to an official
government organization in the United States.
Secure .gov websites use HTTPS
A lock (
) or https:// means you've safely
connected to the .gov website. Share sensitive
information only on official, secure websites.
Diagram of the algorithm that calculates the degree of change of the papilloma coverage area located on the vocal folds.