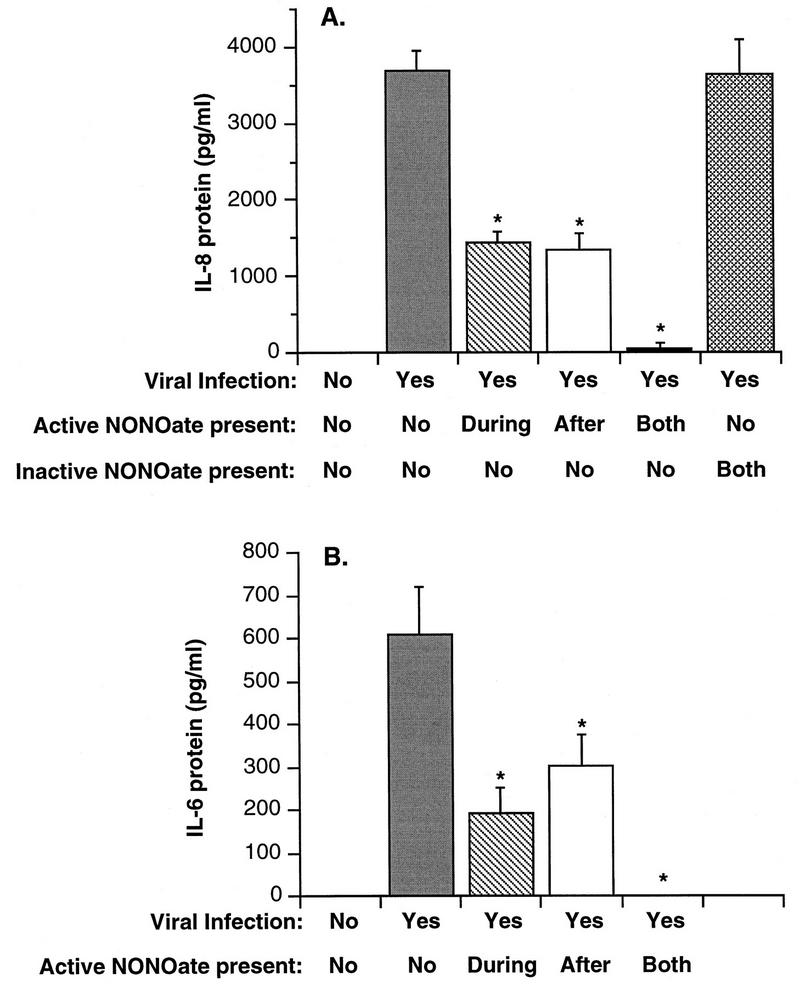
FIG. 8.
Comparison of the effects of inactive NONOate and of active NONOate added at different times during the infection procedure on HRV-16-induced cytokine production from BEAS-2B cells. NONOate was used at a final concentration of 1,000 μM, and protein levels were measured 4 h after infection. (A) Means plus SEM of values for IL-8 production from three experiments; (B) data for IL-6. Asterisks indicate significant inhibition compared to levels produced by virus alone (P < 0.05 in each case).

