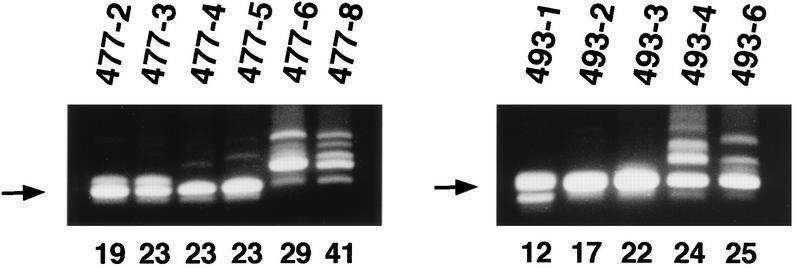
FIG. 3.
PCR amplification of the LTRs in MoFe2-MuLV-induced tumors from two litters of mice (litters 477 and 493) infected independently. LTRs from tumor DNA were amplified by PCR with the primer pair shown in Fig. 1C. The identifying number of each animal (given after the litter number and hyphen) and the latency of tumor induction (in weeks postinoculation) are given above and below the gels, respectively. The arrows indicate the predominant amplification product (457 bp), demonstrated by subsequent sequence analysis to represent the intact MoFe2-MuLV LTR.

