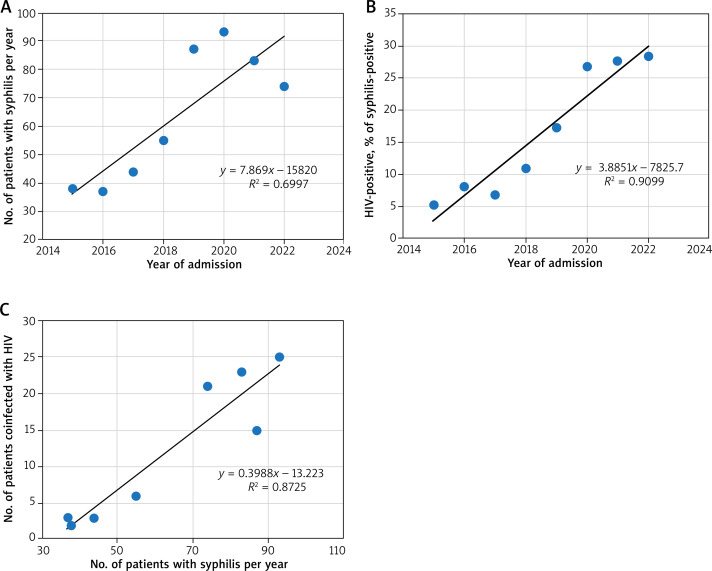
Figure 1.
Numbers of syphilis and HIV positive cases in 2015–2022, including their correlation over time. A – Numbers of syphilis positive cases over the years. The y-axis and the data labels represent the total number of patients with syphilis. The trend line emphasizes the increase in the number of cases per year. B – The percentage of HIV-positive cases among patients coinfected with syphilis over the years. The y-axis and the data labels represent the percentage of patients with HIV. The trend line emphasizes the increase in percent of cases per year. C – Correlation between total yearly number of syphilis and HIV-positive cases. The y-axis represents the total number of patients with HIV in relation to the total number of syphilis patients. The trend line emphasizes positive

