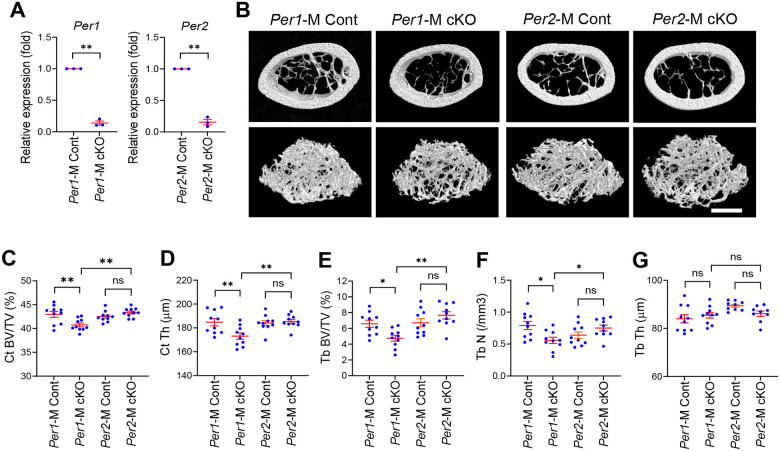
Figure 1. Per1 cKO, but not Per2 cKO, decreased bone mass in male femurs.
A. Relative expression levels of Per1 and Per2 in each cKO male osteoclasts in comparison to Cont osteoclasts on day 6 quantified with qRT-PCR. n = 3.
B. Reconstructed 3D micro-CT images of femoral midshafts (top) and distal femurs (bottom) prepared from 12-week-old male mice of the indicated genotypes. Bar, 1 mm.
C-G. Quantification of the cortical bone volume/total volume ratio (C), cortical thickness (D), trabecular bone volume/total volume ratio (E), trabecular number (F), and trabecular thickness (G) comparing 12-week-old male mice. n = 9 or 10.
Mean ± SEM is shown. ** p < 0.01, * p < 0.05, and ns for not significant with two-way ANOVA with Tukey’s method of multiple comparisons.

