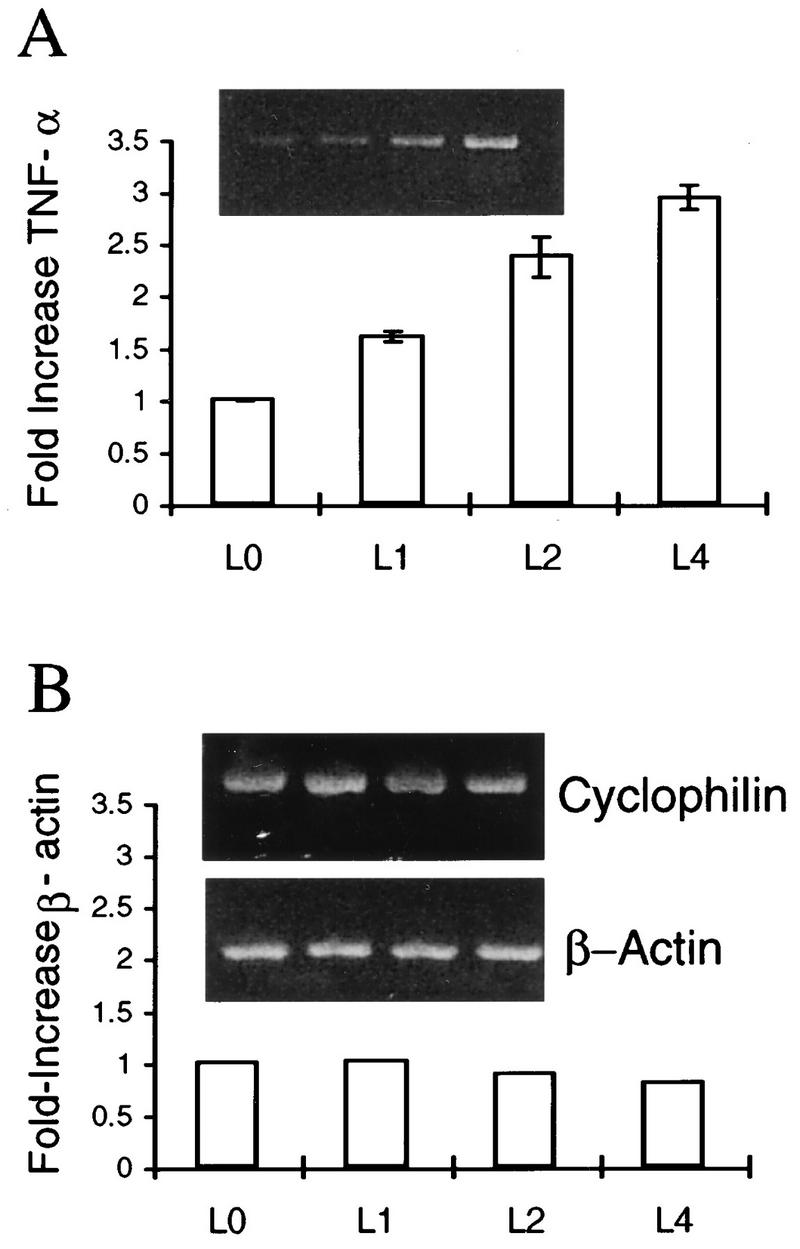
FIG. 8.

RT-PCR detection of TNF-α, cyclophilin, and β-actin transcripts in murine TG cultured for various times p.e. RNA from latently infected TG explants was prepared and analyzed by RT-PCR for TNF-α (A), and β-actin (B), and cyclophilin as described in Materials and Methods. Products were visualized by ethidium bromide staining as shown in the inserts. The graphs represent the ratio between the PCR product band and the cyclophilin band. The ratio at the time of explant (time zero) was determined as 1. Experiments were done in duplicate in four separate experiments. L indicates latent.
