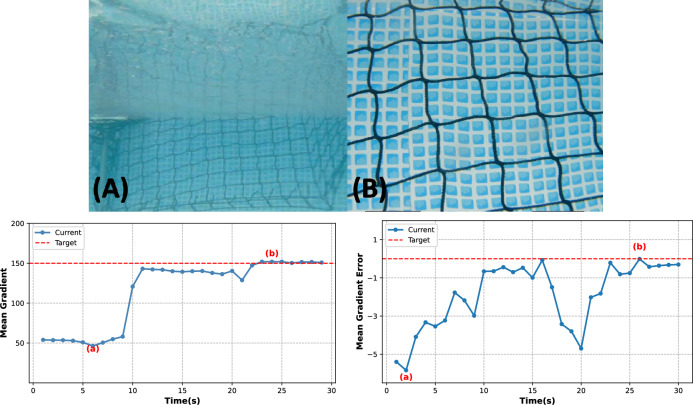
Fig. 9.
Distance and yaw control performance in the garden pool setup. (A) Initial view showing the ROV at a far distance from the net; (B) adjusted view after active control to maintain an optimal inspection distance and alignment. The left plot shows the evolution of mean gradient values over time, indicating that the ROV successfully adjusted its distance to match the target gradient threshold (red line), ensuring clear net visibility. The right plot presents the mean gradient error over time, demonstrating stable yaw control and consistent alignment with the net, highlighting effective visual servoing.

