

Abstract
Identifying amino acid residues that are critical for the catalytic function of enzymes is essential for elucidating reaction mechanisms, facilitating drug discovery, and advancing protein engineering. However, experimentally and computationally distinguishing residues that maintain structural integrity from those directly involved in enzymatic function remains a major challenge. In this study, we developed a methodology to identify amino acid residues that influence substrate specificity in enzymes with homologous structures. We framed the sequence comparison as a classification problem, treating each residue as a feature, thereby enabling the rapid and objective identification of key residues responsible for functional differences. To validate the proposed method, we applied it to three enzyme pairs—trypsin/chymotrypsin, adenylyl cyclase/guanylyl cyclase, and lactate dehydrogenase (LDH)/malate dehydrogenase (MDH). The results confirmed the accurate prediction of previously identified specificity‐determining residues. Furthermore, we conducted experiments on the LDH/MDH pair and successfully introduced mutations into key residues to alter substrate specificity, enabling LDH to utilize oxaloacetate while maintaining its expression levels. These findings demonstrate the potential of this method for efficiently identifying residues that govern substrate specificity. We have further developed this approach into a practical tool, the EZSCAN: Enzyme Substrate‐specificity and Conservation Analysis Navigator (https://ezscan.pe-tools.com/), which enables rapid identification of amino acid residues critical for enzyme function.
Keywords: enzyme, software, substrate specificity
1. INTRODUCTION
Enzymes are biological catalysts that drive chemical reactions with high precision and efficiency. Their catalytic function originates from coordinated conformational changes and electron transfer mediated by amino acid side chains (Arora and Brooks 2007; Hammes 2002; Palmer 2015; Siegbahn and Blomberg 2010). Identifying the amino acid residues essential for catalysis and substrate specificity is critical for understanding structure–function relationships. This knowledge provides practical insights into how mutations contribute to disease pathogenesis and how targeted mutagenesis can be used to redesign enzyme specificity for biotechnological applications, such as metabolic engineering and cell manipulation (Adzhubei et al. 2010; Yue et al. 2005).
Advances in DNA synthesis and sequencing technologies have paved the way for in‐depth studies of mutation–function relationships, such as deep mutational scanning and multiplexed variant assays (Fowler and Fields 2014; Kinney and McCandlish 2019; Starita et al. 2017). These methods systematically mutate each amino acid residue into all 20 possible variants, generating extensive libraries. Using NGS, researchers can identify residues critical for enzyme function by subjecting these populations to functional selection and tracking changes in abundance. Although large‐scale mutation analysis offers functional mutation profiles, distinguishing functionally critical residues from those conserved due to structural constraints remains a challenge, as does identifying synergistic mutations (Li and Lehner 2020). Moreover, as nearly half of the loss‐of‐function mutations result from decreased protein abundance (Cagiada et al. 2021), new approaches are necessary to pinpoint residues directly influencing enzyme function.
In contrast to experimental methods, computational techniques offer rapid, cost‐effective, and scalable alternatives for identifying functionally important residues. Several computational approaches have been developed to predict these residues based on their amino acid sequences. Among these, conservation analysis—which identifies residues that are highly conserved across proteins—has emerged as a powerful tool for identifying functionally critical residues (Kumar et al. 2009; Lichtarge et al. 1996; Lo et al. 2003; Ng and Henikoff 2003). Although this method has provided valuable insights into protein–protein interactions, structural stability, and ligand recognition, it requires refinement to distinguish between residues essential for function and those conserved due to structural constraints. As both functional and structural constraints shape protein evolution, the challenge is to identify residues that are crucial for protein function without being confounded by structural conservation.
Recent advances in molecular biology and machine learning have shed light on how specific amino acid residues determine cofactor specificity. Using supervised learning on amino acid sequence datasets, we previously identified key residues that distinguish between NAD(H)‐ and NADP(H)‐dependent malic enzymes (Sugiki et al. 2022). Despite clear differences in cofactor preferences, these enzymes retain a highly conserved overall structure across species. Guided by machine learning‐based residue rankings, we introduced mutations that not only preserved soluble expression but also completely switched the enzyme's cofactor specificity from NADP to NAD. Notably, these substitutions were well tolerated, underscoring the functional relevance of the identified sites and enabling the separation of structural and functional constraints, which is difficult to achieve through conventional conservation analysis. These findings point to a broader principle: functionally critical residues underlying substrate specificity can be identified by contrasting enzymes that are structurally conserved yet functionally distinct.
In this study, we present a computational framework to uncover the molecular basis of enzyme substrate specificity. By analyzing the sequence datasets of homologous enzymes using supervised machine learning, we identified key amino acid residues that govern substrate recognition. Focusing on three well‐studied enzyme pairs—trypsin/chymotrypsin, adenylyl/guanylyl cyclase (AC/GC), and lactate/malate dehydrogenase (LDH/MDH)—we recovered known specificity‐conferring residues and revealed previously unreported sites critical for function. Experimental validation of the LDH/MDH pair confirmed that the newly identified residues contributed directly to differences in substrate preference. Although protein sequences and functions have diversified through evolution, their three‐dimensional structures are often highly conserved (Illergård et al. 2009; Orengo et al. 1994). Comparative analyses of these protein families can provide key insights into the evolution of functions while maintaining structural constraints. Our approach not only distinguishes functionally relevant positions in structurally similar enzymes but also provides a generalizable strategy for dissecting enzyme specificity. To support its broad adoption, we developed EZSCAN, a web tool that enables researchers to explore substrate recognition features across diverse enzyme families.
2. RESULTS
2.1. Prediction of substrate‐specific residues in enzymes using EZSCAN
The EZSCAN protocol represents an advancement in understanding enzyme functionality through a machine‐learned binary classification algorithm tailored to extract critical amino acid residues linked to enzyme cofactor specificity. In this study, we extended this approach to identify amino acid residues vital for substrate specificity by leveraging two distinct sets of amino acid sequence data (Figure 1). Initially, we obtained amino acid sequences of two sets of enzymes with homologous structures from a comprehensive database. These sequences were aligned using multiple sequence alignment, converted into one‐hot vectors, and subsequently analyzed using a logistic regression model. Given the structural homology between the enzyme sets, our classification of residues associated with enzymatic function is expected to yield meaningful results. The key explanatory variable in the trained model was the amino acid type at each position, and the range between the maximum and minimum partial regression coefficients served as an important evaluative metric.
FIGURE 1.

Schematic illustration of estimation process for specificity‐conferring residues using the EZSCAN protocol. The amino acid sequences of two structurally homologous enzyme groups are used as input data, and a logistic regression model is trained to extract specificity‐conferring residues that distinguish the two enzyme groups. The extracted specificity‐conferring residues can be ranked by their contribution and used for experimental evaluation.
As a practical demonstration, we applied this method to three enzyme pairs—trypsin/chymotrypsin, AC/GC, and LDH/MDH—to identify residues critical for enzymatic function. Despite their differences in substrate preference, these enzyme pairs share homologous structures (Figure 2). The average root mean square deviation (RMSD) and template modeling score (TM‐score) values for each enzyme pair further confirmed their high degree of structural similarity. Details of RMSD and TM scores across all crystal structures are provided in Tables S1–S6, Supporting Information. TM‐scores range from 0 to 1, with values above 0.5 indicative of structural homology (Zhang and Skolnick 2004). In the following sections, we present results identifying amino acid residues that are pivotal for substrate specificity across these different enzymes.
FIGURE 2.

Superimposed images. (a) Trypsin (PDB ID 6T5W, 1ANE, and 1OS8) and chymotrypsin (PDB ID 1KDQ, 1ACB, and 1EQ9). (b) AC (PDB ID 1AB8, 6R3Q, and 7YZI) and GC (PDB ID 2WZ1, 3ET6, and 6PAS). (c) LDH (PDB ID 1LDG, 1LDN, 3VPH, 4AJ2, and 6J9T) and MDH (PDB ID 1B8P, 1HLP, 2PWZ, 4CL3, and 5UJK). Red, yellow, and green regions represent α‐helix, β‐sheet, and random coil structures, respectively. Average values of metrics from the superimposed structures are shown. All scores compared between each structure are shown in Tables S1–S6.
2.2. Trypsin/chymotrypsin
Trypsin and chymotrypsin, both serine proteases, exhibited significant structural homology (Figure 2a). Trypsin is known for cleaving the C‐terminal side of Arg and Lys at the P1 position of substrate peptides, whereas chymotrypsin targets Phe, Tyr, and Trp at the same position (Vajda and Szabo 1976). This distinction in substrate specificity is primarily attributed to the pivotal role of residue S195 (in chymotrypsin numbering), which defines the S1 pocket adjacent to the active site (Steitz et al. 1969). Notably, the negative charge generated by the combination of D189, G216, and G226 (chymotrypsin numbering) significantly influences trypsin substrate specificity. In contrast, S189, G216, and G226 (chymotrypsin numbering) are critical for chymotrypsin specificity (Hedstrom 2002). Interestingly, swapping D189 and S189 alone is insufficient to shift specificity from trypsin‐like to chymotrypsin‐like or vice versa (Graf et al. 1988; Venekei et al. 1996). Additionally, Y172, although not directly involved in substrate interaction, is essential when transitioning substrate specificity between two enzymes (Hedstrom et al. 1994). To explore the predictive potential of EZSCAN for identifying specificity‐conferring residues, we applied the protocol to trypsin and chymotrypsin.
Amino acid sequence data for these enzymes were obtained from the Kyoto Encyclopedia of Genes and Genomes (KEGG), focusing on sequences between 240 and 270 residues in length. A total of 793 trypsin sequences and 652 chymotrypsin sequences were used as input for EZSCAN analysis (Figure S1a). We used trypsin and chymotrypsin structures from Rattus norvegicus as templates to display specificity‐conferring residues. The model predicted Tyr (trypsin) and Trp (chymotrypsin) at residue 172 as the top specificity‐conferring residues (Figure 3a and Table 1). Notably, Asp (trypsin) and Ser (chymotrypsin) at residue 189 were ranked fourth, consistent with prior studies on substrate specificity.
FIGURE 3.

Mapping of specificity‐conferring residues estimated by EZSCAN on the crystal structure. (a) Trypsin derived from R. norvegicus (PDB: 1ANE), (b) AC derived from R. norvegicus (PDB: 1AB8), (c) LDH derived from G. stearothermophilus (PDB: 1LDN). Cyan sticks represent the top 10 ranked amino acid residues estimated by the EZSCAN protocol. Residues previously reported to be involved in substrate specificity are shown in blue; all others are shown in black. The numbers in parentheses indicate their ranking.
TABLE 1.
Top 10 ranked amino acid residues associated with substrate specificity for trypsin/chymotrypsin, AC/GC, and LDH/MDH as predicted by EZSCAN.
| Enzyme (species) | Rank | |||||||||
|---|---|---|---|---|---|---|---|---|---|---|
| 1 | 2 | 3 | 4 | 5 | 6 | 7 | 8 | 9 | 10 | |
| Trypsin (R. norvegicus) | Y172 | Y39 | G219 | D189 | A221 | V27 | C136 | K230 | C157 | G18 |
| Chymotrypsin (R. norvegicus) | W172 | W29 | G218 | S189 | S221 | W27 | C136 | R230 | Q157 | N2 |
| AC (R. norvegicus) | A946 | I1019 | K938 | D1018 | F867 | I919 | C911 | L912 | A890 | I918 |
| GC (B. taurus) | V938 | L1003 | E930 | C1002 | L870 | Y914 | V906 | V907 | S889 | L913 |
| LDH (G. stearothermophilus) | Q86 | E90 | I237 | A223 | T233 | Y224 | N170 | E178 | G29 | T149 |
| MDH (E. coli) | R81 | M85 | M227 | G210 | A223 | T211 | E168 | G176 | P25 | T147 |
Note: The predicted residue positions correspond to the amino acid positions in each template enzyme. For trypsin/chymotrypsin, the residue numbering follows the chymotrypsin numbering scheme.
The second ranked residue, Tyr (trypsin) and Trp (chymotrypsin) at residue 39, is located distally from the active site but is conserved in mesotrypsin, which is known to interact with protease inhibitors (Salameh et al. 2012). These residues may modulate enzyme activity indirectly, for instance, by limiting solvent accessibility to the active site or inducing subtle conformational adjustments. Additionally, the third ranked residue at position 219 and the fifth ranked residue at position 221 form a loop near the substrate pocket, indicating their likely contribution to the substrate recognition process. Notably, the trypsin D189S mutation alone does not alter catalytic activity; however, substitution of the entire loop with a chymotrypsin‐like sequence confers chymotrypsin‐like specificity (Hedstrom 2002; Hedstrom et al. 1992). Thus, this loop plays a direct role in defining the substrate pocket architecture, and the G219S and A221S substitutions likely contribute to its conformational stabilization and regulatory control.
2.3. AC/GC
AC and GC are crucial enzymes in signal transduction, responsible for converting ATP and GTP into cAMP and cGMP, respectively. ACs are classified into five categories based on their structural characteristics (Barzu and Danchin 1994; Sismeiro et al. 1998). Notably, Class III ACs exhibit a close phylogenetic relationship with GCs, and their catalytic domains demonstrate significant structural homology (Figure 2b). The catalytic domain of mammalian Class III AC exists as a heterodimer composed of C1 and C2 domains, whereas the bacterial and protozoan counterparts are homodimeric (Liu et al. 1997; Zhang et al. 1997). These enzymes exhibit strict selectivity for ATP or GTP, with specific amino acid residues at the dimer interface playing a pivotal role in determining substrate specificity (Tesmer et al. 1997; Tesmer et al. 1999; Whisnant et al. 1996). For instance, it has been shown that GC from Bos taurus can be engineered to function similarly to AC through just two amino acid substitutions at the active site—E930K and C1002D (Tucker et al. 1998). In contrast, similar modifications at corresponding sites in AC from R. norvegicus did not produce a substantial change in substrate specificity.
Residue I1019 has been implicated in the formation of hydrogen bonds with the N‐6 amino group of ATP and is considered essential for this process (Sunahara et al. 1998). We aimed to evaluate whether such specificity‐conferring residues in AC and GC could be predicted using the EZSCAN software.
Amino acid sequence data for AC and GC were obtained from the KEGG database. We analyzed 319 ACs and 572 GCs, with sequence lengths ranging from 1090 to 1130 amino acids (Figure S1b). In this analysis, AC from R. norvegicus and GC from B. taurus served as template structures for identifying specificity‐conferring residues. EZSCAN identified E930 and C1002 as the third and fourth highest‐ranked residues for AC from R. norvegicus, consistent with previous findings demonstrating their role in shifting substrate specificity (Figure 3b and Table 1). Another key residue, I1019, ranked second and is known to directly interact with the substrate.
The top‐ranked mutation in GC has been implicated in central areolar choroidal dystrophy, a genetic eye disease (Hughes et al. 2012), indicating its potential significance in cyclase function. This residue is located within 8 Å of I1019 and K938, both of which have previously been examined for their roles in substrate specificity conversion, and together they constitute part of the substrate pocket. Therefore, this residue is likely to be directly involved in determining substrate specificity. Interestingly, although our analysis encompassed the full‐length sequences of both AC and GC, the top‐ranked residues predominantly resided in the C2 domain. This finding aligns with prior studies (Childers and Garcin 2018; Linder 2005; Sunahara et al. 1998; Tucker et al. 1998) and suggests that the presence of non‐homologous transmembrane domains does not interfere with the identification of residues essential for substrate specificity.
2.4. LDH/MDH
LDH and MDH are essential redox enzymes characterized by structural homology and a reliance on NAD(H) as a cofactor (Figure 2c). LDH catalyzes the interconversion between lactate and pyruvate, while MDH is involved in the conversion of malate and oxaloacetate (Adeva‐Andany et al. 2014; Goward and Nicholls 1994). The differences in substrate specificity between these enzymes are primarily due to variations in amino acid residues within their substrate‐binding sites. Notably, LDH from Geobacillus stearothermophilus can acquire MDH activity through a single Q86R mutation (Wilks et al. 1988). Conversely, introducing the reverse mutation into MDH from Escherichia coli does not result in a comparable enhancement in LDH activity (Cendrin et al. 1993; Nicholls et al. 1992). Furthermore, one study reported that introducing five specific mutations—I12V, R81Q, M85E, G210A, and V214I—dramatically increased the k cat/K M value of E. coli MDH from 0.14 to 3500 M−1 s−1 (Yin and Kirsch 2007). These findings raise an important question: can EZSCAN accurately identify the residues responsible for such differences in substrate specificity between LDH and MDH?
We sourced amino acid sequences for LDH and MDH from the UniProtKB database and analyzed 228 LDH and 397 MDH sequences. The sequence lengths ranged from 300 to 340 amino acids (Figure S1c). Using LDH from G. stearothermophilus and MDH from E. coli as template structures, we identified key specificity‐conferring residues. Residues Q81, M85, and G210, previously reported to play crucial roles in substrate specificity, were ranked first, second, and fourth, respectively (Figure 3c and Table 1). The fifth‐ranked mutation, from Thr to Gly, was shown to reduce the enzymatic activity of G. stearothermophilus LDH by more than 1000‐fold, highlighting its importance in substrate recognition (Wilks et al. 1988). Interestingly, the third‐ranked residue, I237, has not been previously reported but is located at the base of the substrate pocket, suggesting a potential role in influencing substrate specificity.
We applied the EZSCAN protocol to three enzyme pairs based on prior experimental findings. This approach successfully identified amino acid residues known to determine substrate specificity and ranked them prominently. Additionally, EZSCAN revealed new candidate residues that have not been examined previously, offering valuable targets for future experimental validation. This method also provides a comprehensive view by quantifying the contribution of all 20 amino acid variants at each residue position, enabling a clearer understanding of the mechanisms underlying enzyme specificity (Figures S2–S4). These findings support the conclusion that machine learning analysis of homologous enzyme sequences can effectively uncover substrate specificity–conferring residues.
2.5. Selection of LDH for experimental validation
We experimentally validated the amino acid residues associated with substrate specificity, as predicted by the EZSCAN protocol. LDH catalyzes the interconversion between pyruvate and lactate, whereas MDH catalyzes the conversion of oxaloacetate to malate (Figure 4a). To evaluate the accuracy of EZSCAN predictions, we assessed whether the specificity of template LDHs for pyruvate could be decreased and their specificity for oxaloacetate increased.
FIGURE 4.

(a) Reactions catalyzed by LDH and MDH. (b) Phylogenetic tree constructed from the LDH/MDH dataset used for model training. Blue and orange branches represent LDH and MDH, respectively. (c) Aligned amino acid sequences of pfLDH, gsLDH, and lcLDH. Dashes indicate alignment gaps. An insertion of SDKEW is observed at positions 89–93 in pfLDH. Residue numbering corresponds to pfLDH. (d) Design of pfLDH_trunc, in which residues 89–93 (SDKEW) of pfLDH are deleted. Black indicates the truncated region; magenta and cyan highlight residues ranked first and second in importance, respectively.
Four LDHs from three species were used as template enzymes, and the EZSCAN‐predicted specificity‐conferring residues in these LDHs were replaced with MDH‐like residues. The LDHs selected for mutagenesis were LDH from G. stearothermophilus (gsLDH; UniProt ID: P00344), LDH from Lactobacillus casei (lcLDH; UniProt ID: P00343), and LDH from Plasmodium falciparum (pfLDH; UniProt ID: Q27743). gsLDH has previously been reported to acquire MDH activity via a single Q86R mutation (Wilks et al. 1988). lcLDH was selected because it has a lower optimal pH (4.8) than other LDHs (Hensel et al. 1977), which could lead to distinct mutational effects compared with gsLDH.
pfLDH is a unique LDH found within the MDH clade rather than the LDH clade (Figure 4b), suggesting it may have arisen by convergent evolution from an MDH ancestor (Boucher et al. 2014). Its sequence is therefore expected to resemble that of MDH, making it a suitable candidate for examining differences between enzyme templates. Alignment of pfLDH with gsLDH and lcLDH revealed a five‐amino acid insertion from S89 to W93 in pfLDH (Figure 4c). These inserted residues are located in the same loop where EZSCAN ranked residues first and second in importance, suggesting that the insertion likely alters the shape of the substrate pocket (Figure S5).
In addition to wild‐type pfLDH, we designed a truncated variant, pfLDH_trunc, in which the five‐residue insertion was removed (Figure 4d). Structural prediction indicated that pfLDH_trunc is homologous to gsLDH and lcLDH (Figure S5). Using these four types of LDHs as templates, we evaluated whether the EZSCAN‐predicted specificity‐conferring residues, when replaced, would alter substrate specificity.
2.6. Experimental validation of substrate specificity conversion
The investigation of four types of LDH involved substituting residues identified by the EZSCAN protocol with MDH‐like amino acid residues to assess their impact on substrate specificity. Mutations were introduced sequentially, following the ranking shown in Table 1 by EZSCAN, to prioritize residues predicted to have a major impact on substrate specificity. Because substrate switching often arises from combinations of mutations rather than single substitutions, the cumulative introduction of mutations was used to capture potential epistatic interactions while maintaining enzyme stability. All amino acid sequence information can be found in the Supporting Information, under the sequence information section. Because pfLDH retained its third‐ranked Pro residue, pfLDH3 incorporated the fourth‐ranked amino acid, pfLDH4 added the fifth‐ranked residue, and pfLDH5 introduced the sixth‐ranked residue.
Each gene encoding the wild‐type LDH and its corresponding mutants was cloned into a pET28a expression vector. Expression was carried out in E. coli BL21(DE3), and purification was performed using a Ni‐NTA column. All LDH variants, including the mutants, were obtained in the soluble fraction. Expression levels ranged from 40.0 to 167.2% relative to each wild‐type pfLDH, with no significant decrease in expression observed (Figure S6).
To analyze substrate specificity, the purified enzymes were tested using pyruvate and oxaloacetate, and initial reaction velocities were determined by monitoring NADH oxidation at 340 nm. Kinetic parameters were derived from these initial velocities via nonlinear fitting, as shown in Figure 5. Notably, the Q86R mutation in gsLDH (gsLDH1) drastically reduced its LDH activity, resulting in a 438‐fold reduction in the k cat/K M value of the wild‐type level. At the same time, it enabled MDH activity that was undetectable in the wild‐type enzyme. gsLDH1 exhibited a k cat/K M for MDH of 366.1 mM−1 s−1, surpassing the wild‐type LDH activity. This switch in substrate specificity due to the Q86R mutation is consistent with previous findings (Wilks et al. 1988). Further mutations in gsLDH3 caused LDH activity to fall below detection limits, yielding a purely MDH‐like enzyme. gsLDH4 showed a 4.4‐fold increase in MDH activity compared to gsLDH3, while gsLDH5 lost MDH activity entirely.
FIGURE 5.
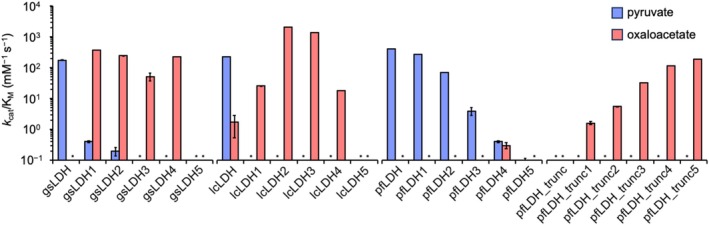
Enzyme activity (k cat/K M) of each LDH variant before and after mutation, based on rankings from the EZSCAN protocol. Blue bars represent enzyme activity using pyruvate as the substrate, and red bars represent activity using oxaloacetate. Data were collected in triplicate. Asterisks indicate cases in which k cat/K M values could not be determined. Michaelis–Menten plots and fitted curves are provided in Figure S7. The k cat and K M values for each LDH are listed in Table S7.
In contrast, lcLDH lost LDH activity with just a single mutation (Q88R), while showing a 15‐fold increase in MDH activity, which had previously been nearly undetectable. The lcLDH2 variant, incorporating the additional second‐ranked mutation (E92M), displayed an 80‐fold increase in MDH activity—a 1191‐fold increase over the wild type. However, as more mutations were added, MDH activity gradually declined, and lcLDH5 ultimately lost all MDH activity.
For pfLDH, a consistent decline in LDH activity was observed with each successive mutation, ranked according to EZSCAN. pfLDH5 retained only 1/3987 of the wild‐type LDH activity. Although pfLDH4 exhibited slight MDH activity, the conversion to MDH‐like specificity was not as pronounced as in gsLDH or lcLDH. These results suggest that the SDKEW insertion sequence, spanning residues 159–163 in pfLDH, hinders the acquisition of MDH activity while preserving LDH function.
We further evaluated pfLDH_trunc, in which the SDKEW sequence was removed. This truncation led to a complete loss of LDH activity, consistent with previous findings (Boucher et al. 2014; Wirth et al. 2018). This outcome underscores the importance of the SDKEW loop structure in maintaining LDH activity. Interestingly, pfLDH_trunc gained progressively stronger MDH activity with the introduction of additional mutations. Among these, pfLDH_trunc5 exhibited the highest MDH activity. This result suggests that converting pfLDH to MDH functionality—likely governed by a distinct reaction mechanism—requires both structural adjustments to the backbone near functional residues and targeted substitutions.
These findings validate that EZSCAN‐predicted residues directly influence substrate specificity. All introduced mutations led to reductions in LDH activity while promoting MDH activity without significantly affecting expression levels. This confirms that the amino acid residues identified by EZSCAN are indeed specificity‐conferring residues.
3. DISCUSSION
Directed evolution is a widely employed and powerful strategy in protein engineering. However, the vast sequence space of proteins makes it challenging to efficiently identify variants with the desired functions efficiently (Zeymer and Hilvert 2018). In typical directed evolution, random mutations or DNA shuffling are introduced into natural proteins, followed by high‐throughput screening under selective pressure to enhance protein properties such as activity or stability. Although the number of substitutions required to achieve a functional shift varies depending on the direction of engineering, a few to a dozen amino acid changes are often sufficient for functional enhancement or adaptation. Importantly, protein function and stability often exhibit a trade‐off relationship (Bigman and Levy 2020; Tokuriki et al. 2008), highlighting the need for strategies that improve function without compromising structural integrity. A key to the successful design for substrate specificity conversion is to distinguish amino acids that contribute to function from those responsible for structure, and to focus mutations only on the former.
Computational tools are indispensable for identifying important amino acid residues in proteins, particularly for scalable and broadly applicable analyses (Ebert and Pelletier 2017; Planas‐Iglesias et al. 2021). Although recent methods using NMR chemical shifts have shown promise in narrowing down potential mutation sites (Ashkenazy et al. 2016; Khersonsky et al. 2018), in silico approaches remain central to efficiently exploring large sequence spaces. Among these, evolutionary conservation information is frequently used to estimate the functional or structural contribution of each amino acid residue (Bhattacharya et al. 2022; Gutierrez‐Rus et al. 2025). Highly conserved residues are likely essential for protein folding and biological activity in native contexts. However, one of the remaining challenges is separating residues critical for specific functions from those involved in structural integrity—something that conventional conservation‐based methods alone cannot achieve.
In this study, we proposed a methodology in which hundreds of amino acid sequences from two structurally homologous enzyme groups are analyzed using a simple linear regression equation to extract amino acid residues where differences in substrate specificity between the enzyme groups appear. Three structurally homologous enzyme pairs (trypsin/chymotrypsin, AC/GC, and LDH/MDH) that had already been investigated in previous studies were selected, and an attempt was made to extract the amino acid residues responsible for substrate specificity from evolutionary information. By applying this method, we accurately estimated amino acid residues that are experimentally known to confer substrate specificity and identified new amino acid residues that have not yet been investigated. Furthermore, the deduced amino acid residues for the LDH/MDH pair were experimentally validated. Four LDHs from three phylogenetically distinct species were selected, and the amino acid residues identified by the ranking‐based analysis were replaced with MDH‐like residues to evaluate substrate specificity. The results showed that substrate specificity shifted stepwise from pyruvate to oxaloacetate as mutations accumulated. Furthermore, the expression levels of all mutants varied in the range of 40.0%–167.2%, and the introduced mutations had no significant effect on expression levels. These results suggest that the amino acid residues inferred using this method are indeed responsible for functional specificity.
We also examined the involvement of conserved amino acid residues in substrate specificity. Using the 228 LDH sequences previously employed in our EZSCAN protocol to identify substrate specificity differences between LDH and MDH, we calculated the conservation level for each residue. Highly conserved residues were distributed throughout the protein sequence (Figure 6a). Interestingly, the top five residues predicted by EZSCAN as functionally important for LDH activity had conservation ratios ranging from 85.2% to 98.8%. When the conservation ratios of all residues were mapped onto the three‐dimensional structure of gsLDH, we observed that the conserved residues were particularly concentrated in the structural core, the multimer interface, and the substrate‐binding pocket of the protein (Figure 6b). This pattern supports earlier findings that residues in the structural core evolve more slowly than those on the surface (Illergård et al. 2009). In total, 72 residues in the gsLDH sequence had conservation ratios above 0.8, making it difficult to determine which residues were specifically responsible for substrate recognition (Figure 6c). In addition, trypsin and AC were analyzed. The datasets for trypsin and AC also display broad phylogenetic coverage (Figure S8). Trypsin from R. norvegicus was used as a reference for the conservation analysis. Although 27 residues (11.0% of the total) were conserved at >90%, the top five residues identified by EZSCAN showed conservation levels of only 67.7% to 83.5% (Figure S9a). For Y39 (chymotrypsin numbering), which was particularly low, 97.8% of the corresponding residues in chymotrypsin were strongly conserved as Trp. This indicates that EZSCAN detects residues that differ from those highlighted by simple conservation analysis. In AC, among the around 300 residues located after residue 800, where the catalytic domain is known to reside, 95 residues were conserved at >90% (Figure S9b). These findings suggest that substrate‐specific residues can be hidden in highly conserved regions, making them difficult to identify using conservation‐based methods alone. Notably, several key residues identified using our method were not completely conserved, implying that some functionally important residues may tolerate minor evolutionary variation. This highlights the need for comparison methods that consider not only sequence conservation but also functional divergence. Our approach, which contrasts sequences based on functional differences among structurally related enzymes, offers a promising strategy for identifying such critical residues.
FIGURE 6.

Visualization of conserved residues. (a) Conservation scores of each amino acid residue using gsLDH as the reference sequence. Scores closer to 1 indicate higher conservation. Red plots indicate the top 1–5 ranked positions predicted by the EZSCAN protocol as critical for LDH function. (b) Structural representation of gsLDH (PDB ID: 1LDB) with conservation scores mapped onto each residue. The color bar indicates the conservation ratio. (c) List of amino acid residues with conservation scores of 0.8 or higher. Residues highlighted in red represent the top 1–5 ranked positions predicted by the EZSCAN protocol as critical for LDH function.
To make this method broadly accessible, we developed a user‐friendly software tool called EZSCAN. Many proteins share structural similarities despite performing different biological functions. This structural similarity can be explored using databases such as SCOP (Andreeva et al. 2020), CATH (Sillitoe et al. 2021), and InterPro (Blum et al. 2025), which classify proteins based on their structural and evolutionary relationships. For example, the SCOP database defines over 5900 families of proteins that share structural motifs but often fulfill distinct biological roles. In addition to these databases, online tools such as Foldseek (van Kempen et al. 2024), DALI (Holm et al. 2023), and PDBeFold (Krissinel and Henrick 2004) can rapidly identify proteins with similar structures. It should be noted, however, that the relationship between structural homology and prediction accuracy has not been fully addressed and remains an issue for future investigation. In this study, EZSCAN was applied to enzyme pairs with structural homology scores ranging from 1.5 to 2.69 by RMSD and from 0.739 to 0.904 by TM‐score. We anticipate that broader applications of this tool will help delineate the limits of its applicability. EZSCAN can be used not only to identify amino acid residues responsible for enzyme substrate specificity but also to highlight differences between other structurally similar protein pairs that differ in function. With the rapid expansion of amino acid sequence data from genome and metagenome projects, and the increasing availability of predicted protein structures driven by deep learning, the potential applications of EZSCAN are expected to grow significantly across both biology and biotechnology.
In summary, we have proposed a methodology for extracting substrate specificity‐conferring residues using a linear regression‐based classification program that compares groups of enzymes with homologous sequences. The estimated amino acid residues alter substrate specificity without disrupting overall protein structure. This method enables the identification and extraction of shared sequence patterns important for protein function and structure—something difficult to achieve using conservation information alone. Furthermore, because the method is highly interpretable, relying only on a linear model, it may prove useful for experimental validation of protein function and for selecting mutational targets in protein engineering.
4. MATERIALS AND METHODS
4.1. Data collection and computational prediction
The amino acid sequences of trypsin, chymotrypsin, AC, GC, LDH, and MDH were collected from the UniProt (Bateman et al. 2021) and KEGG (Kanehisa and Goto 2000) databases. Sequence data were retrieved using EC numbers as queries and filtered by length based on enzymes characterized in previous studies. For the trypsin/chymotrypsin pair, the sequence lengths of trypsin and chymotrypsin from R. norvegicus were 246 and 263 amino acids, respectively; therefore, sequences were restricted to the range of 245–265 amino acids. Similarly, for AC and GC, the sequence lengths of AC from R. norvegicus and GC from B. taurus were 1108 and 1110 amino acids, respectively; therefore, sequences were restricted to the range of 1090–1120 amino acids. For LDH/MDH, sequences obtained from SwissProt, the curated section of UniProt, were used without further filtering. The sequences were classified based on substrate selectivity and curated into non‐redundant datasets for supervised machine learning. These sequences were analyzed using the scheme named the EZSCAN protocol. MSA was performed using the MAFFT (Katoh et al. 2002) and MUSCLE (Edgar 2022) software to standardize sequence lengths for each enzyme pair (trypsin/chymotrypsin, AC/GC, and LDH/MDH). The aligned enzyme sequences were then converted into one‐hot vectors of size M × N (Equation (1)), where the two enzymes in each pair were assigned labels of one and zero, respectively, as teacher labels. Here, M represents the number of amino acid types, and N corresponds to the sequence length, including gaps,
| (1) |
The one‐hot vectors of size M × N derived from the amino acid sequences were subsequently converted into a linear polynomial comprising an intercept term β₀ and coefficient terms (Equation (2)). This polynomial was then incorporated into a logistic function to model the features distinguishing two enzyme pairs, with output values ranging from zero to one (Equation (3)). 70% of the data used for training and 30% for testing. The term β optimized using the steepest descent method,
| (2) |
| (3) |
We defined the score for each amino acid residue position as the difference between the maximum and minimum values of the model's partial regression coefficient β at that position (Equation (4)). This score was calculated for all positions and ranked based on its magnitude. We assumed that residues with higher rankings contribute more significantly to substrate specificity, and introduced mutations additively into the template enzyme in accordance with the ranking,
| (4) |
4.2. Structure similarity analysis
The crystal structures of trypsin, chymotrypsin, AC, GC, LDH, and MDH were obtained from the Protein Data Bank. The PDB IDs for these crystal structures are listed in the headers of Tables S1–S7. Structural alignment for each enzyme pair was conducted using TM‐align (Zhang and Skolnick 2005). The aligned structures, along with the corresponding RMSD and TM‐score, were outputs generated by TM‐align.
4.3. Phylogenetic analysis
Phylogenetic analysis was performed to evaluate sequence diversity and to confirm that the dataset spans a sufficient evolutionary depth. The amino acid sequences of trypsin/chymotrypsin, AC/GC, and LDH/MDH used in the EZSCAN protocol were employed for this analysis. MSA was performed using MAFFT (Katoh et al. 2002) and poorly aligned regions were removed. The phylogenetic tree was constructed using the maximum likelihood method in IQ‐Tree 2 (Minh et al. 2020). The Bayesian information criterion with ModelFinder (Kalyaanamoorthy et al. 2017) was used for selecting the substitution, with the LG + R9 model being selected. The reliability of the estimated clade was evaluated using the bootstrap method with UFBoot2 (Hoang et al. 2018) and 1500 bootstrap iterations. The phylogenetic trees for trypsin/chymotrypsin and AC/GC are shown in Figure S9, and the tree for LDH/MDH is shown in Figure 4b.
4.4. Plasmid construction
Wild‐type lcLDH, gsLDH, pfLDH, and their corresponding mutants were synthesized using the GeneArt gene synthesis service (ThermoFisher Scientific, Waltham, MA). Each DNA fragment was amplified via PCR using KOD polymerase (Toyobo, Osaka, Japan) and subsequently purified. The genes and the pET28a vector were digested with NdeI and XhoI restriction enzymes (New England Biolabs, Ipswich, MA), followed by ligation into the linearized pET28a vector using T4 DNA ligase (Toyobo). The pfLDH_trunc expression plasmids were constructed using inverse PCR and a self‐ligation method with the pfLDH expression plasmids as templates. All strains used in this study were selected on LB agar plates supplemented with 30 μg mL−1 kanamycin. The integrity of the gene sequences was verified by Sanger sequencing.
4.5. Protein expression and purification
E. coli strain BL21(DE3) was transformed with the constructed plasmids and plated on LB agar containing 30 μg mL−1 kanamycin. A single colony was randomly selected and grown in LB liquid medium with 30 μg mL−1 kanamycin at 37°C. Following overnight incubation, the culture was transferred into baffled Erlenmeyer flasks containing 2× YT medium with 30 μg mL−1 kanamycin and grown at 37°C with shaking. When the optical density at 600 nm reached 0.4–0.6, IPTG was added to a final concentration of 0.5 mM to induce protein expression, and the culture was incubated overnight at 18°C with shaking.
Cells were harvested by centrifugation and lysed using BugBuster Master Mix (Merck Millipore, Burlington, MA). After gently stirring at room temperature for 20 min, the lysate was centrifuged, and the supernatant was collected. The supernatants were filtered through 0.22 μm pore size membranes (Merck, Kenilworth, NJ) and applied to Ni‐NTA resin‐packed columns for purification. The resin was washed with Buffer A (50 mM Tris–HCl, 200 mM NaCl, and 50 mM imidazole) and eluted with Buffer B (50 mM Tris–HCl, 200 mM NaCl, and 300 mM imidazole). The eluted proteins were subjected to buffer exchange into Buffer C (50 mM Tris–HCl and 200 mM NaCl) using a PD‐10 column (Cytiva, Marlborough, MA). Protein concentrations were determined by measuring absorbance at 280 nm.
4.6. Kinetic assay
Enzyme activity was assessed by monitoring the dynamic consumption of NADH during the reductive conversion of pyruvate to lactate and oxaloacetate to malate, measured at 340 nm using a Synergy HTX multi‐mode reader (Agilent Technologies Inc., Santa Clara, CA). Each reaction was performed in a 200 μL volume, and measurements were taken for 10 min, with the enzyme solution added last to initiate the reaction.
The reaction mixture contained 0.3 mM NADH, 50 mM Tris–HCl (pH 7.4) for wild‐type gsLDH, pfLDH, pfLDH_trunc, and their variants, or 50 mM acetate buffer (pH 4.8) for wild‐type lcLDH and its variants. The mixture also included 3 mM fructose‐1,6‐bisphosphate as an activator (Arai et al. 2002) and 0.01 to 35 mM sodium pyruvate or 0.01 to 4 mM oxaloacetate as the substrate. The rate of substrate conversion was calculated based on changes in NADH absorbance. Kinetic parameters were derived from the average values of three independent replicates. The reaction rate was determined from the slope of the linear portion of the absorbance curve and fitted to the Michaelis–Menten model using Python.
AUTHOR CONTRIBUTIONS
Seiya Mori: Investigation; formal analysis; writing – original draft; visualization. Teppei Niide: Conceptualization; methodology; formal analysis; writing – review and editing; visualization; project administration; supervision. Yoshihiro Toya: Methodology; writing – review and editing. Hiroshi Shimizu: Conceptualization; writing – review and editing; resources; project administration; supervision.
CONFLICT OF INTEREST STATEMENT
The authors declare no conflicts of interest.
Supporting information
Data S1. Histogram of amino acid sequence length that was used in the machine learning dataset (Figure S1); aligned heatmap of specificity‐conferring residues in trypsin/chymotrypsin, AC/GC, and LDH/MDH (Figures S2–S4); structural models of pfLDH_trunc (Figure S5); SDS‐PAGE image of purified LDHs and their yield (Figure S6); substrate‐dependent kinetics of LDH and MDH reactions (Figure S7); phylogenetic trees constructed from input data of trypsin/chymotrypsin and AC/GC (Figure S8); conservation ratios of each amino acid residue using trypsin and AC (Figure S9); RMSD and TM‐score values of pairwise structures of trypsin/chymotrypsin, AC/GC, and LDH/MDH (Tables S1–S6); kinetic parameters of LDHs (Table S7).
ACKNOWLEDGMENTS
We are grateful to Keiko Hiratomi and Satoko Wake for their expert technical assistance. This work was supported by Japan Society for the Promotion of Science KAKENHI (22K04841; T.N.), ACT‐X (JPMJAX20BC; T.N.), PRESTO (JPMJPR24G5; T.N.), GteX (JPMJGX23B4; T.N. and Y.T.), BOOST (JPMJBS2402; S.M.) Japan Science and Technology Agency.
Mori S, Niide T, Toya Y, Shimizu H. A method for predicting enzyme substrate specificity residues using homologous sequence information. Protein Science. 2025;34(10):e70318. 10.1002/pro.70318
Review Editor: Lynn Kamerlin
Contributor Information
Teppei Niide, Email: tniide@ist.osaka-u.ac.jp.
Hiroshi Shimizu, Email: shimizu@ist.osaka-u.ac.jp.
DATA AVAILABILITY STATEMENT
The data that support the findings of this study are available from the corresponding author upon reasonable request.
REFERENCES
- Adeva‐Andany M, López‐Ojén M, Funcasta‐Calderón R, Ameneiros‐Rodríguez E, Donapetry‐García C, Vila‐Altesor M, et al. Comprehensive review on lactate metabolism in human health. Mitochondrion. 2014;17:76–100. [DOI] [PubMed] [Google Scholar]
- Adzhubei IA, Schmidt S, Peshkin L, Ramensky VE, Gerasimova A, Bork P, et al. A method and server for predicting damaging missense mutations. Nat Methods. 2010;7:248–249. [DOI] [PMC free article] [PubMed] [Google Scholar]
- Andreeva A, Kulesha E, Gough J, Murzin AG. The SCOP database in 2020: expanded classification of representative family and superfamily domains of known protein structures. Nucleic Acids Res. 2020;48:D376–D382. [DOI] [PMC free article] [PubMed] [Google Scholar]
- Arai K, Hishida A, Ishiyama M, Kamata T, Uchikoba H, Fushinobu S, et al. An absolute requirement of fructose 1,6‐bisphosphate for the L‐lactate dehydrogenase activity induced by a single amino acid substitution. Protein Eng. 2002;15:35–41. [DOI] [PubMed] [Google Scholar]
- Arora K, Brooks CL. Large‐scale allosteric conformational transitions of adenylate kinase appear to involve a population‐shift mechanism. Proc Natl Acad Sci U S A. 2007;104:18496–18501. [DOI] [PMC free article] [PubMed] [Google Scholar]
- Ashkenazy H, Abadi S, Martz E, Chay O, Mayrose I, Pupko T, et al. ConSurf 2016: an improved methodology to estimate and visualize evolutionary conservation in macromolecules. Nucleic Acids Res. 2016;44:W344–W350. [DOI] [PMC free article] [PubMed] [Google Scholar]
- Barzu O, Danchin A. Adenylyl cyclases: a heterogeneous class of ATP‐utilizing enzymes. Prog Nucleic Acid Res Mol Biol. 1994;49:241–283. [DOI] [PubMed] [Google Scholar]
- Bateman A, Martin MJ, Orchard S, Magrane M, Agivetova R, Ahmad S, et al. UniProt: the universal protein knowledgebase in 2021. Nucleic Acids Res. 2021;49:D480–D489. [DOI] [PMC free article] [PubMed] [Google Scholar]
- Bhattacharya S, Margheritis EG, Takahashi K, Kulesha A, D'Souza A, Kim I, et al. NMR‐guided directed evolution. Nature. 2022;610:389. [DOI] [PMC free article] [PubMed] [Google Scholar]
- Bigman LS, Levy Y. Proteins: molecules defined by their trade‐offs. Curr Opin Struct Biol. 2020;60:50–56. [DOI] [PubMed] [Google Scholar]
- Blum M, Andreeva A, Florentino LC, Chuguransky SR, Grego T, Hobbs E, et al. InterPro: the protein sequence classification resource in 2025. Nucleic Acids Res. 2025;53:D444–D456. [DOI] [PMC free article] [PubMed] [Google Scholar]
- Boucher JI, Jacobowitz JR, Beckett BC, Classen S, Theobald DL. An atomic‐resolution view of neofunctionalization in the evolution of apicomplexan lactate dehydrogenases. Elife. 2014;3:e02304. [DOI] [PMC free article] [PubMed] [Google Scholar]
- Cagiada M, Johansson KE, Valanciute A, Nielsen SV, Hartmann‐Petersen R, Yang JJ, et al. Understanding the origins of loss of protein function by analyzing the effects of thousands of variants on activity and abundance. Mol Biol Evol. 2021;38:3235–3246. [DOI] [PMC free article] [PubMed] [Google Scholar]
- Cendrin F, Chroboczek J, Zaccai G, Eisenberg H, Mevarech M. Cloning, sequencing, and expression in Escherichia coli of the gene coding for malate‐dehydrogenase of the extremely halophilic archaebacterium Haloarcula‐Marismortui. Biochemistry. 1993;32:4308–4313. [DOI] [PubMed] [Google Scholar]
- Childers KC, Garcin ED. Structure/function of the soluble guanylyl cyclase catalytic domain. Nitric Oxide‐Biol Ch. 2018;77:53–64. [DOI] [PMC free article] [PubMed] [Google Scholar]
- Ebert MCCJC, Pelletier JN. Computational tools for enzyme improvement: why everyone can—and should—use them. Curr Opin Chem Biol. 2017;37:89–96. [DOI] [PubMed] [Google Scholar]
- Edgar RC. Muscle5: high‐accuracy alignment ensembles enable unbiased assessments of sequence homology and phylogeny. Nat Commun. 2022;13:6968. [DOI] [PMC free article] [PubMed] [Google Scholar]
- Fowler DM, Fields S. Deep mutational scanning: a new style of protein science. Nat Methods. 2014;11:801–807. [DOI] [PMC free article] [PubMed] [Google Scholar]
- Goward CR, Nicholls DJ. Malate‐dehydrogenase—a model for structure, evolution, and catalysis. Protein Sci. 1994;3:1883–1888. [DOI] [PMC free article] [PubMed] [Google Scholar]
- Graf L, Jancso A, Szilagyi L, Hegyi G, Pinter K, Narayszabo G, et al. Electrostatic complementarity within the substrate‐binding pocket of trypsin. Proc Natl Acad Sci U S A. 1988;85:4961–4965. [DOI] [PMC free article] [PubMed] [Google Scholar]
- Gutierrez‐Rus LI, Vos E, Pantoja‐Uceda D, Hoffka G, Gutierrez‐Cardenas J, Ortega‐Muñoz M, et al. Enzyme enhancement through computational stability design targeting NMR‐determined catalytic hotspots. J Am Chem Soc. 2025;147(18):14978–14996. [DOI] [PMC free article] [PubMed] [Google Scholar]
- Hammes GG. Multiple conformational changes in enzyme catalysis. Biochemistry. 2002;41:8221–8228. [DOI] [PubMed] [Google Scholar]
- Hedstrom L. Serine protease mechanism and specificity. Chem Rev. 2002;102:4501–4523. [DOI] [PubMed] [Google Scholar]
- Hedstrom L, Perona JJ, Rutter WJ. Converting trypsin to chymotrypsin—Residue‐172 is a substrate‐specificity determinant. Biochemistry. 1994;33:8757–8763. [DOI] [PubMed] [Google Scholar]
- Hedstrom L, Szilagyi L, Rutter WJ. Converting trypsin to chymotrypsin: the role of surface loops. Science. 1992;255:1249–1253. [DOI] [PubMed] [Google Scholar]
- Hensel R, Mayr U, Fujiki H, Kandler O. Comparative studies of lactate dehydrogenases in lactic acid bacteria. Amino‐acid composition of an active‐site region and chemical properties of the L‐lactate dehydrogenase of Lactobacillus casei, Lactobacillus curvatus, Lactobacillus plantarum, and Lactobacillus acidophilus . Eur J Biochem. 1977;80:83–92. [DOI] [PubMed] [Google Scholar]
- Hoang DT, Chernomor O, von Haeseler A, Minh BQ, Vinh LS. UFBoot2: improving the ultrafast bootstrap approximation. Mol Biol Evol. 2018;35:518–522. [DOI] [PMC free article] [PubMed] [Google Scholar]
- Holm L, Laiho A, Toronen P, Salgado M. DALI shines a light on remote homologs: one hundred discoveries. Protein Sci. 2023;32:e4519. [DOI] [PMC free article] [PubMed] [Google Scholar]
- Hughes AE, Meng WH, Lotery AJ, Bradley DT. A novel mutation, V933A, causes central areolar choroidal dystrophy. Invest Ophthalmol Vis Sci. 2012;53:4748–4753. [DOI] [PubMed] [Google Scholar]
- Illergård K, Ardell DH, Elofison A. Structure is three to ten times more conserved than sequence—a study of structural response in protein cores. Proteins. 2009;77:499–508. [DOI] [PubMed] [Google Scholar]
- Kalyaanamoorthy S, Minh BQ, Wong TKF, von Haeseler A, Jermiin LS. ModelFinder: fast model selection for accurate phylogenetic estimates. Nat Methods. 2017;14:587–589. [DOI] [PMC free article] [PubMed] [Google Scholar]
- Kanehisa M, Goto S. KEGG: Kyoto encyclopedia of genes and genomes. Nucleic Acids Res. 2000;28:27–30. [DOI] [PMC free article] [PubMed] [Google Scholar]
- Katoh K, Misawa K, Kuma K, Miyata T. MAFFT: a novel method for rapid multiple sequence alignment based on fast Fourier transform. Nucleic Acids Res. 2002;30:3059–3066. [DOI] [PMC free article] [PubMed] [Google Scholar]
- Khersonsky O, Lipsh R, Avizemer Z, Ashani Y, Goldsmith M, Leader H, et al. Automated design of efficient and functionally diverse enzyme repertoires. Mol Cell. 2018;72:178–186.e5. [DOI] [PMC free article] [PubMed] [Google Scholar]
- Kinney JB, McCandlish DM. Massively parallel assays and quantitative sequence‐function relationships. Annu Rev Genomics Hum Genet. 2019;20:99–127. [DOI] [PubMed] [Google Scholar]
- Krissinel E, Henrick K. Secondary‐structure matching (SSM), a new tool for fast protein structure alignment in three dimensions. Acta Crystallogr D Biol Crystallogr. 2004;60:2256–2268. [DOI] [PubMed] [Google Scholar]
- Kumar P, Henikoff S, Ng PC. Predicting the effects of coding non‐synonymous variants on protein function using the SIFT algorithm. Nat Protoc. 2009;4:1073–1081. [DOI] [PubMed] [Google Scholar]
- Li X, Lehner B. Biophysical ambiguities prevent accurate genetic prediction. Nat Commun. 2020;11:4923. [DOI] [PMC free article] [PubMed] [Google Scholar]
- Lichtarge O, Bourne HR, Cohen FE. An evolutionary trace method defines binding surfaces common to protein families. J Mol Biol. 1996;257:342–358. [DOI] [PubMed] [Google Scholar]
- Linder JU. Substrate selection by class III adenylyl cyclases and guanylyl cyclases. IUBMB Life. 2005;57:797–803. [DOI] [PubMed] [Google Scholar]
- Liu Y, Ruoho AE, Rao VD, Hurley JH. Catalytic mechanism of the adenylyl and guanylyl cyclases: modeling and mutational analysis. Proc Natl Acad Sci U S A. 1997;94:13414–13419. [DOI] [PMC free article] [PubMed] [Google Scholar]
- Lo LW, Shakhnovich EI, Mirny LA. Amino acids determining enzyme‐substrate specificity in prokaryotic and eukaryotic protein kinases. Proc Natl Acad Sci U S A. 2003;100:4463–4468. [DOI] [PMC free article] [PubMed] [Google Scholar]
- Minh BQ, Schmidt HA, Chernomor O, Schrempf D, Woodhams MD, von Haeseler A, et al. IQ‐TREE 2: new models and efficient methods for phylogenetic inference in the genomic era. Mol Biol Evol. 2020;37:1530–1534. [DOI] [PMC free article] [PubMed] [Google Scholar]
- Ng PC, Henikoff S. SIFT: predicting amino acid changes that affect protein function. Nucleic Acids Res. 2003;31:3812–3814. [DOI] [PMC free article] [PubMed] [Google Scholar]
- Nicholls DJ, Miller J, Scawen MD, Clarke AR, Holbrook JJ, Atkinson T, et al. The importance of Arginine‐102 for the substrate‐specificity of Escherichia coli malate‐dehydrogenase. Biochem Biophys Res Co. 1992;189:1057–1062. [DOI] [PubMed] [Google Scholar]
- Orengo CA, Jones DT, Thornton JM. Protein superfamilies and domain superfolds. Nature. 1994;372:631–634. [DOI] [PubMed] [Google Scholar]
- Palmer AG. Enzyme dynamics from NMR spectroscopy. Accounts Chem Res. 2015;48:457–465. [DOI] [PMC free article] [PubMed] [Google Scholar]
- Planas‐Iglesias J, Marques SM, Pinto GP, Musil M, Stourac J, Damborsky J, et al. Computational design of enzymes for biotechnological applications. Biotechnol Adv. 2021;47:107696. [DOI] [PubMed] [Google Scholar]
- Salameh MA, Soares AS, Alloy A, Radisky ES. Presence versus absence of hydrogen bond donor Tyr‐39 influences interactions of cationic trypsin and mesotrypsin with protein protease inhibitors. Protein Sci. 2012;21:1103–1112. [DOI] [PMC free article] [PubMed] [Google Scholar]
- Siegbahn PE, Blomberg MR. Quantum chemical studies of proton‐coupled electron transfer in metalloenzymes. Chem Rev. 2010;110:7040–7061. [DOI] [PubMed] [Google Scholar]
- Sillitoe I, Bordin N, Dawson N, Waman VP, Ashford P, Scholes HM, et al. CATH: increased structural coverage of functional space. Nucleic Acids Res. 2021;49:D266–D273. [DOI] [PMC free article] [PubMed] [Google Scholar]
- Sismeiro O, Trotot P, Biville F, Vivares C, Danchin A. Aeromonas hydrophila adenylyl cyclase 2: a new class of adenylyl cyclases with thermophilic properties and sequence similarities to proteins from hyperthermophilic archaebacteria. J Bacteriol. 1998;180:3339–3344. [DOI] [PMC free article] [PubMed] [Google Scholar]
- Starita LM, Ahituv N, Dunham MJ, Kitzman JO, Roth FP, Seelig G, et al. Variant interpretation: functional assays to the rescue. Am J Hum Genet. 2017;101:315–325. [DOI] [PMC free article] [PubMed] [Google Scholar]
- Steitz TA, Henderson R, Blow DM. Structure of crystalline alpha‐chymotrypsin. 3. Crystallographic studies of substrates and inhibitors bound to active site of alpha‐chymotrypsin. J Mol Biol. 1969;46:337. [DOI] [PubMed] [Google Scholar]
- Sugiki S, Niide T, Toya Y, Shimizu H. Logistic regression‐guided identification of cofactor specificity‐contributing residues in enzyme with sequence datasets partitioned by catalytic properties. ACS Synth Biol. 2022;11:3973–3985. [DOI] [PMC free article] [PubMed] [Google Scholar]
- Sunahara RK, Beuve A, Tesmer JJG, Sprang SR, Garbers DL, Gilman AG. Exchange of substrate and inhibitor specificities between adenylyl and guanylyl cyclases. J Biol Chem. 1998;273:16332–16338. [DOI] [PubMed] [Google Scholar]
- Tesmer JJ, Sunahara RK, Gilman AG, Sprang SR. Crystal structure of the catalytic domains of adenylyl cyclase in a complex with Gsalpha.GTPgammaS. Science. 1997;278:1907–1916. [DOI] [PubMed] [Google Scholar]
- Tesmer JJ, Sunahara RK, Johnson RA, Gosselin G, Gilman AG, Sprang SR. Two‐metal‐ion catalysis in adenylyl cyclase. Science. 1999;285:756–760. [DOI] [PubMed] [Google Scholar]
- Tokuriki N, Stricher F, Serrano L, Tawfik DS. How protein stability and new functions trade off. PLoS Comput Biol. 2008;4:e1000002. [DOI] [PMC free article] [PubMed] [Google Scholar]
- Tucker CL, Hurley JH, Miller TR, Hurley JB. Two amino acid substitutions convert a guanylyl cyclase, RetGC‐1, into an adenylyl cyclase. Proc Natl Acad Sci U S A. 1998;95:5993–5997. [DOI] [PMC free article] [PubMed] [Google Scholar]
- Vajda T, Szabo T. Specificity of trypsin and alpha‐chymotrypsin towards neutral substrates. Acta Biochim Biophys. 1976;11:287–294. [PubMed] [Google Scholar]
- van Kempen M, Kim SS, Tumescheit C, Mirdita M, Lee J, Gilchrist CLM, et al. Fast and accurate protein structure search with Foldseek. Nat Biotechnol. 2024;42:243–246. [DOI] [PMC free article] [PubMed] [Google Scholar]
- Venekei I, Szilagyi L, Graf L, Rutter WJ. Attempts to convert chymotrypsin to trypsin. FEBS Lett. 1996;379:143–147. [PubMed] [Google Scholar]
- Whisnant RE, Gilman AG, Dessauer CW. Interaction of the two cytosolic domains of mammalian adenylyl cyclase. Proc Natl Acad Sci U S A. 1996;93:6621–6625. [DOI] [PMC free article] [PubMed] [Google Scholar]
- Wilks HM, Hart KW, Feeney R, Dunn CR, Muirhead H, Chia WN, et al. A specific, highly‐active malate‐dehydrogenase by redesign of a lactate‐dehydrogenase framework. Science. 1988;242:1541–1544. [DOI] [PubMed] [Google Scholar]
- Wirth JD, Boucher JI, Jacobowitz JR, Classen S, Theobald DL. Functional and structural resilience of the active site loop in the evolution of plasmodium lactate dehydrogenase. Biochemistry. 2018;57:6434–6442. [DOI] [PMC free article] [PubMed] [Google Scholar]
- Yin Y, Kirsch JF. Identification of functional paralog shift mutations: conversion of Escherichia coli malate dehydrogenase to a lactate dehydrogenase. Proc Natl Acad Sci U S A. 2007;104:17353–17357. [DOI] [PMC free article] [PubMed] [Google Scholar]
- Yue P, Li ZL, Moult J. Loss of protein structure stability as a major causative factor in monogenic disease. J Mol Biol. 2005;353:459–473. [DOI] [PubMed] [Google Scholar]
- Zeymer C, Hilvert D. Directed evolution of protein catalysts. Annu Rev Biochem. 2018;87:131–157. [DOI] [PubMed] [Google Scholar]
- Zhang G, Liu Y, Ruoho AE, Hurley JH. Structure of the adenylyl cyclase catalytic core. Nature. 1997;386:247–253. [DOI] [PubMed] [Google Scholar]
- Zhang Y, Skolnick J. Scoring function for automated assessment of protein structure template quality. Proteins. 2004;57:702–710. [DOI] [PubMed] [Google Scholar]
- Zhang Y, Skolnick J. TM‐align: a protein structure alignment algorithm based on the TM‐score. Nucleic Acids Res. 2005;33:2302–2309. [DOI] [PMC free article] [PubMed] [Google Scholar]
Associated Data
This section collects any data citations, data availability statements, or supplementary materials included in this article.
Supplementary Materials
Data S1. Histogram of amino acid sequence length that was used in the machine learning dataset (Figure S1); aligned heatmap of specificity‐conferring residues in trypsin/chymotrypsin, AC/GC, and LDH/MDH (Figures S2–S4); structural models of pfLDH_trunc (Figure S5); SDS‐PAGE image of purified LDHs and their yield (Figure S6); substrate‐dependent kinetics of LDH and MDH reactions (Figure S7); phylogenetic trees constructed from input data of trypsin/chymotrypsin and AC/GC (Figure S8); conservation ratios of each amino acid residue using trypsin and AC (Figure S9); RMSD and TM‐score values of pairwise structures of trypsin/chymotrypsin, AC/GC, and LDH/MDH (Tables S1–S6); kinetic parameters of LDHs (Table S7).
Data Availability Statement
The data that support the findings of this study are available from the corresponding author upon reasonable request.