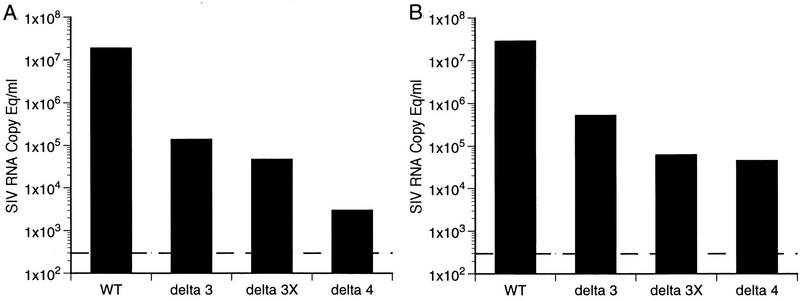
FIG. 3.
Early plasma SIV RNA loads. The median plasma RNA values at week 1 postinoculation (A) and at peak (B) for each group of infected animals are derived from the data shown in Fig. 2. The dashed lines indicate the threshold sensitivity of the assay.

