

Abstract
Learning to read involves the formation and tuning of letter representations, but it is unknown whether this orthographic tuning influences very early visual processing or only later processing. This study tested the hypothesis that experience increases the extraction of sensory information about letters by comparing the EEG activity elicited by upright and inverted letters. In a set of conventional univariate analyses, we found that inverted letters elicited larger P1 amplitudes (starting ca. 110 ms) and larger N170 amplitudes (starting ca.160 ms) compared to upright letters. These larger amplitudes could reflect enhanced processing, but they might instead reflect degraded processing. We therefore performed multivariate pattern classification (decoding) to assess the amount of information about letter identity in the neural signal. Specifically, we decoded which individual letter was presented from the pattern of voltage across the scalp at each time point. We found that decoding accuracy was greater for upright letters than for inverted letters during the P1 latency range (starting ca. 90 ms), particularly in electrodes over the left hemisphere, This provides evidence for enhanced tuning for upright letters in early visual processing. By contrast, we found higher decoding accuracy for inverted letters than for upright letters during and after the N170 component (starting ca.140 ms). These results demonstrate that massive experience with upright letters influences sensory processing, leading to enhanced feature extraction for highly familiar (upright) letter forms at an early stage, followed by enhanced neural discriminability for less familiar (inverted) letter forms at a later stage.
Keywords: Letter perception, N170, EEG decoding, perceptual learning, reading
Introduction
Reading is a culturally invented behavior that is now essential for individuals of most societies. It is highly practiced, to the point of feeling effortless for many readers, but it is a demanding task for the visual system. Reading is a complex but also highly structured behavior: readers must perform quick and precise eye movements to efficiently sample sentences, recognize words from sets of highly similar and crowded letters, and integrate this visual information with higher level linguistic structures. To the untrained visual system, the visual forms of orthographic stimuli such as words and letters are arbitrary and must be learned through experience. Hence, reading provides an opportunity to study the extent to which sensory processing is affected by natural experience. Prior research suggests that the difficulty and specificity of this behavior does indeed lead to significant tuning in perceptual systems, which enables the efficient visual processing required for reading (see Dehaene et al., 2010; Dehaene et al., 2015). The goal of the present study was to test the hypothesis that reading experience causes changes in the initial sensory processing of letters, increasing the brain’s ability to rapidly extract visual features that are relevant for discriminating letter identity. We begin by briefly reviewing the current evidence of neural tuning for orthographic stimuli, and then we move on to the question of whether experience increases the extraction of sensory information about letter identity.
Functional imaging evidence for orthographic tuning
Learning to read produces widespread changes in the visual system, especially in left ventral occipitotemporal cortex where reading experience is thought to cause areas of cortex to be repurposed to recognize written language (Dehaene and Cohen, 2007). Most notably, experience with reading leads to the formation of the so-called visual word-form area (VWFA), a region that is critical for visual word recognition (Cohen and Dehaene, 2004). Various studies have shown that this area responds more strongly to written words than to scrambled words or non-lexical objects (Szwed et al., 2011), but is also tuned to sublexical features of words including single letters (Dehaene et al., 2004) and bigrams (Binder et al., 2006). Although there are fewer studies focused on anatomically earlier cortical visual areas, some studies indicate that tuning for known words exists as early as V1/V2 in French readers (Szwed et al., 2011; Szwed et al., 2014) and as early as V3/V4 for Mandarin readers (Szwed et al., 2014). However, this evidence comes from fMRI studies, and the poor temporal resolution of this method makes it difficult to determine whether the effects reflect changes in the tuning of feedforward sensory processing or instead reflect feedback (e.g., prediction error signals) from higher level language networks (see Price & Devlin, 2011).
Electrophysiological evidence for orthographic tuning
The excellent temporal resolution of electrophysiological measures provides another avenue to assess the effects of reading experience on the tuning of early visual processing. Lexical effects are commonly reported in relatively late, post-perceptual phases of the event-related potential (ERP) waveform, for instance during the N400 component (see Kutas and Federmeier; 2011). However lexical effects can also be observed much earlier; for example, item-level analyses of ERP responses to visual words have shown that lexical frequency—a measure of how often a word is used in its language—predicts the ERP amplitude starting around 150 ms (Hauk et al., 2006; Chen et al., 2015; Winsler et al, 2023). This is one piece of evidence for effects of experience on visual processing because readers have greater experience with more-frequent words.
However, the clearest findings indicating visual tuning to orthographic stimuli have been from studies of the visual N1/N170 ERP component1 in response to orthographic stimuli. The sensitivity of the N170 component to visual content was first observed in studies of face perception, in which faces elicit a larger negativity around 170 ms compared to other objects such as cars, particularly at electrodes over right occipitotemporal cortex (Bentin et al., 1996). Subsequently, it was shown that orthographic stimuli (e.g., words) generated larger N170s than non-orthographic stimuli (e.g., symbol strings), but that this N170 effect was largest in the left hemisphere (Bentin et al., 1999). This hemispheric difference between the right-lateralized face N170 and the left-lateralized word N170 is consistent with the lateralization of locations cortical regions involved in processing these stimuli classes; for instance the fusiform face area in right inferior-temporal cortex (Kanwisher & Yovel, 2006) and the VWFA in left inferior-temporal cortex (Cohen and Dehaene, 2004). In general, the N170 is thought to be an index of specialized visual processing for behaviorally important and highly-learned visual categories such as faces and words.
Because orthographic representations (e.g., letters and words) must be learned through experience, N170 effects in response to orthographic stimuli are considered to be markers of visual expertise for print. One key piece of evidence that the orthographic N170 results from tuning due to print experience is that orthographic N170 effects emerge and become more left-lateralized as children develop and become better readers (Maurer et al., 2006; Maurer & McCandliss 2007; Zhao et al., 2014; Uno, Kasai, & Seki, 2024). One informative study using a sample of literate and illiterate adults found that reading ability was associated with larger N170-like ERP responses to multiple categories of visual stimuli, but the left lateralization of responses to letter strings was particularly correlated with reading ability (Pegado et al., 2014). While there is considerable variability in reported N170 effects—across languages, over the choice of stimuli (e.g., comparing words to pseudowords or words to symbol strings), and the degree of left-lateralization—it is generally accepted that orthographic N170 effects represent the impact of learned, specialized visual processing that enables the fast, automatic recognition of orthographic stimuli (see Amora et al., 2022 for a review).
The timing of orthographic processing effects
The timing of the orthographic N170 effect provides some information about the stage of processing at which reading experience influences orthographic processing. Specifically, the finding that ERP amplitudes differ between familiar orthographic stimuli (e.g. words) and unfamiliar controls (e.g. non-word letter strings) words by approximately 150 ms indicates that the brain is differentially processing these categories by this time. Although this is sometimes considered an “early” perceptual effect, a great deal of visual processing has taken place by 150 ms (Chen et al., 2007; Foxe & Simpson, 2002; Schmolesky et al., 1998), and effects beginning at this time could reflect either unfolding feedforward visual processes or feedback from higher-level language systems. To conclude that reading experience impacts early perceptual processing, it would therefore be necessary to demonstrate effects at earlier latencies (e.g., <100 ms).
Few ERP studies have reported effects indicating orthographic tuning prior to the N170, but there is some evidence for such effects. For instance, Kim & Straková (2012) found that the rotation of letters within words modulated both P1 and N170 amplitudes, whereas differences between words and pseudowords did not begin until the time period of the N170. This suggests that manipulations at the level of letter processing may be the key for measuring the earliest effects of orthographic tuning.
In alphabetic scripts, words are made up of combinations of letters, and letter processing is the starting place of the visual word recognition process (Grainger, 2018). Hence, measuring perceptual processing of single letters may provide a window into the earliest point at which reading experience influences orthographic tuning. Studies have revealed that, just as words elicit larger N170s than pseudowords, single letters elicit larger N170s compared to pseudo-letters in the fovea (Stevens et al., 2013; Toussi et al, 2023). In addition, crowded arrays of 3 letters in the parafovea elicit larger N170s compared to crowded arrays of 3 symbols (Winsler, Grainger, and Holcomb, 2022).
A common manipulation in N170 studies is the inversion of stimuli, which is a particularly good manipulation for examining effects of experience on early visual processing because it disrupts familiarity while fully controlling for most low-level features. Controlling for these features is especially important for measuring early sensory or perceptual effects, which may be quite sensitive to low-level features such as spatial frequency or perimetric complexity. Inversion delays the latency and increases the amplitude of N170 responses for both faces (Rossion et al., 2000) and words (Rossion et al., 2003) relative to their upright versions, but to our knowledge, there are no published N170 studies comparing single upright and inverted letters. However, one study did compare ERPs to single letters and mirror reversed letters, finding larger P1 and N170 responses to reversed letters in adults but not children (Blackburne et al., 2014), suggesting that indeed, early effects of experience (e.g., on the P1) may be observable by using isolated letters. The current study aimed to provide a rigorous examination of early visual tuning for orthographic stimuli.
The value of multivariate pattern analysis in assessing the effects of experience
Previous research has focused on the amplitude of the ERP signal, but it is unclear exactly what a larger ERP indicates in terms of the underlying information processing. For example, a greater amplitude may indicate that more information is being extracted or that more excitatory neurotransmission is occurring, but it may instead indicate that processing is less efficient, that more inhibitory neurotransmission is occurring, or that larger non-specific error signals are being generated. Thus, whereas showing that familiar and unfamiliar orthographic stimuli produce different amplitudes at a given latency indicates that experience influences processing at that latency, it does not provide much insight into how processing differs between familiar and unfamiliar stimuli.
An approach that may be more revealing involves using multivariate decoding techniques that attempt to classify which of several different stimuli (e.g., different letters) was being viewed on the basis of subtle differences in the pattern of the electromagnetic signal over the sensors produced by the different stimuli (Grootswagers, Wardle, & Carlson, 2017). For example, if the letters A, B, C, and D produce different patterns of voltage across scalp electrodes, then it should be possible for a decoder to use the observed pattern of voltage produced by a given letter to guess which of these four letters was presented with accuracy greater than 1 out of 4 (0.25). Under a reasonable set of assumptions, the accuracy of the decoder will vary in proportion to the amount of information about stimulus identity that is present in the neural signal. Thus, this approach can be used to determine whether more information is being extracted about individual stimuli in a familiar category (e.g., upright letters) compared to an unfamiliar category (e.g., inverted letters).
One decoding study showed that individual short words could be classified from EEG signals by approximately 100 ms after word onset (Ling et al., 2019); however, this study did not include stimuli from an unfamiliar category, so it does not provide evidence about the role of experience on neural tuning. A more relevant decoding study using MEG data showed that it is possible to decode whether a visual stimulus is an alphanumeric character (a letter or number) or a stimulus from a false font by approximately 100 ms (Nara et al., 2023). Another relevant study using EEG data from developing Cantonese readers showed that it is possible to decode whether a stimulus is a Chinese character or a random stroke combination by approximately 100 ms (Lui et al., 2021).
Results like these suggest that experience impacts the processing of orthographic stimuli as early as 100 ms. However, such results could reflect physical stimulus differences between the stimulus categories that would be decodable even without prior reading experience. Moreover, these results still do not assess the amount of information being extracted about the identities of the items from the familiar and unfamiliar categories (e.g., whether a stimulus is the letter A or the letter B). Thus, although previous decoding studies establish the plausibility of the hypothesis that experience increases the amount of sensory information that the visual system extracts about letter identity, there has been no direct test of this hypothesis.
The present study
The present study used a combination of traditional ERP amplitude analyses and multivariate ERP decoding analyses to test the hypothesis that reading experience changes the tuning of early visual processing. To focus on early orthographic processing, we used single isolated letters as stimuli. Familiarity was manipulated by presenting the letter upright on some trials and inverted on other trials, following from previous studies which found early effects of familiarity by using transformations of individual letters (e.g., rotation in Kim & Straková, 2012, and mirror-reversal in Blackburne et al., 2014). To maximize the ability to detect early effects, we developed a paradigm in which a very large number of trials was obtained for each letter, which gave us the signal-to-noise ratio to detect small but early changes in the ERPs. We then used multivariate pattern analyses to decode which specific letter was presented, separately for upright and inverted letters. This allowed us to compare decoding accuracy for distinguishing among the upright letters versus decoding accuracy for distinguishing among the inverted letters. The hypothesis that reading experience increases the extraction of sensory information relevant for discriminating among letters leads to the prediction that decoding accuracy for letter identity will be greater for upright letters than for inverted letters, beginning at an early latency.
The multivariate analyses were supplemented with traditional univariate analyses to compare the mean amplitude across the set of upright letters versus the set of inverted letters. Following from previous univariate results showing larger P1s to mirror-reversed letters (Blackburne et al., 2014), we predicted that P1 amplitude would be greater for inverted letters than for upright letters. If a larger P1 amplitude indicates improved extraction of information, this larger P1 for inverted letters might be expected to be accompanied by greater decoding accuracy for inverted letters. However, as noted above, a larger amplitude could indicate poorer processing, so the prediction of a larger P1 amplitude for inverted letters does not conflict with our prediction that decoding accuracy should be greater for upright letters than for inverted letters.
As a secondary goal, the study was also designed to test whether differences in processing between upright and inverted letters were specific to retinal locations that are particularly relevant for reading. To do this, we presented the stimuli at three different locations: fovea, left parafovea, and right parafovea. The most important retinal location for reading is the fovea, but readers also actively use parafoveal information about upcoming words, which for readers of Latin scripts is in the right parafovea (see Schotter et al., 2012). Hence, any early visual tuning for letters may be particularly prominent at the fovea and the right parafovea (as has been observed for visual crowding; see Winsler & Luck, 2025). If our hypothesis of early perceptual tuning for familiar letters is correct, then initial decoding differences between upright and inverted letters may be larger for stimuli in the fovea and right parafovea compared to stimuli in the left parafovea. This would provide further evidence that tuning for letters occurs in early, location-specific stages of visual processing and is indeed related to reading experience.
A third goal of our study was to better understand the nature of the processing underlying orthographic N170 effects. Following from previous findings of larger N170s to inverted words (e.g., Rossion et al., 2003), we predicted that the univariate N170 would also be larger for inverted letters than for upright letters. If this larger N170 for inverted letters reflects enhanced processing (e.g., due to longer-lasting or more in-depth processing of less-familiar stimuli), then decoding accuracy should be greater for inverted letters than for upright letters in the N170 time range. In contrast, if the N170 is larger for inverted letters than for upright letters because of disrupted processing (e.g., due to generic attentional or error signals that are not specific to the individual stimuli), then decoding accuracy should be greater for upright letters than for inverted letters in this time period. A third possibility is that decoding accuracy will be greater for upright than inverted letters during the initial portion of the N170, reflecting superior recognition of familiar stimuli, followed by greater decoding accuracy for inverted than upright letters, reflecting extended processing for the inverted letters. This would fit with the evidence of N170 latency shifts, with inverted stimuli generating slightly later N170s than their upright counterparts (e.g., Rossion et al., 2003).
Method
Participants
Data from 30 participants were used in all analyses. This sample size was chosen prior to data collection to have high power to detect subtle early ERP effects. The participants were students enrolled at the University of California, Davis2. All participants were native and current readers of a Latin script (in our sample: English, Spanish, or Indonesian), native being defined as learned as their first written language or concurrently with their first written language. All participants considered themselves fluent in English, with 17 participants being monolingual English speakers. Thirteen participants could also speak one or more languages other than English (in our sample this included; Spanish, Indonesian, Mandarin, Cantonese, and Hindi). The participants in our sample had an average age of 22.34 years (SD = 2.66). Most of our participants reported being right-handed (26 right-handed, 4 left-handed), and most identified as women (22 women, 7 men, 1 non-binary). All participants reported having normal or corrected-to-normal vision. Some participants were rejected on the basis of poor behavioral performance or EEG artifacts (discussed below), and these participants were replaced until we reached our target N of 30. This study was approved by the Institutional Review Board at University of California, Davis (protocol 228989). All participants provided informed consent, and all personally identifiable information was removed from the data.
Materials and procedure
Stimulus presentation was controlled using PsychoPy (Pierce, 2007). Stimuli were presented on an HP ZR2440w LCD display with a gray background (26.8 cd/m2) at a nominal viewing distance of 100 cm.
Over the course of the experiment, participants viewed single letters appearing in random order at one of three locations: centered at fixation or at 1.5° of visual angle to the right or left of fixation. The eccentricity of ±1.5° was chosen such that the right location fell roughly within the asymmetrical perceptual span of Latin script readers (see Rayner et al, 2010). Each letter was selected at random from a set of six black upper-case letters (F, G, J, L, N, R) drawn in the Arial typeface with a height subtending 1.0° of visual angle. These letters were either in their familiar upright orientation, or inverted (i.e., reflected across the horizontal axis). The set of letters was selected such that the upright and inverted forms of a given letter were clearly different from each other (as opposed to letters such as B, which are identical or nearly identical when upright and inverted). In total there were six conditions, three levels of Location (left, foveal, right) by two levels of Familiarity (upright or inverted). In each of these six conditions, each of the six letters was presented 120 times, leading to a total of 4320 trials. These trials were randomly shuffled across twelve blocks of 360 trials.
The stimuli and task are illustrated in Figure 1. Each trial began with the participant fixating at the center of the screen, which was marked by the intersection of horizontal and vertical thin dark gray lines that extended to the edge of the screen. There were also two vertical lines at the left and right locations, so that all stimuli were presented on top of intersecting horizontal and vertical lines. After 400 ms of this ITI screen, an upright or inverted letter was presented for 100 ms at one of the three locations on top of the dark-gray lines. Participants were instructed to maintain fixation at the central location. The task for participants was to recognize each stimulus as it appeared so that they could report the letter identity if it was followed by a probe array, which occurred after a random 0.5% of trials. The probe array occurred after the ITI screen, and it contained the 6 possible letters, distributed in a 3×2 grid. The ordering of the letters in the grid varied randomly from array to array so that participants would not learn to associate a letter identity with a specific location. This was important to ensure that we would not be decoding the location associated with a given letter.
Figure 1.
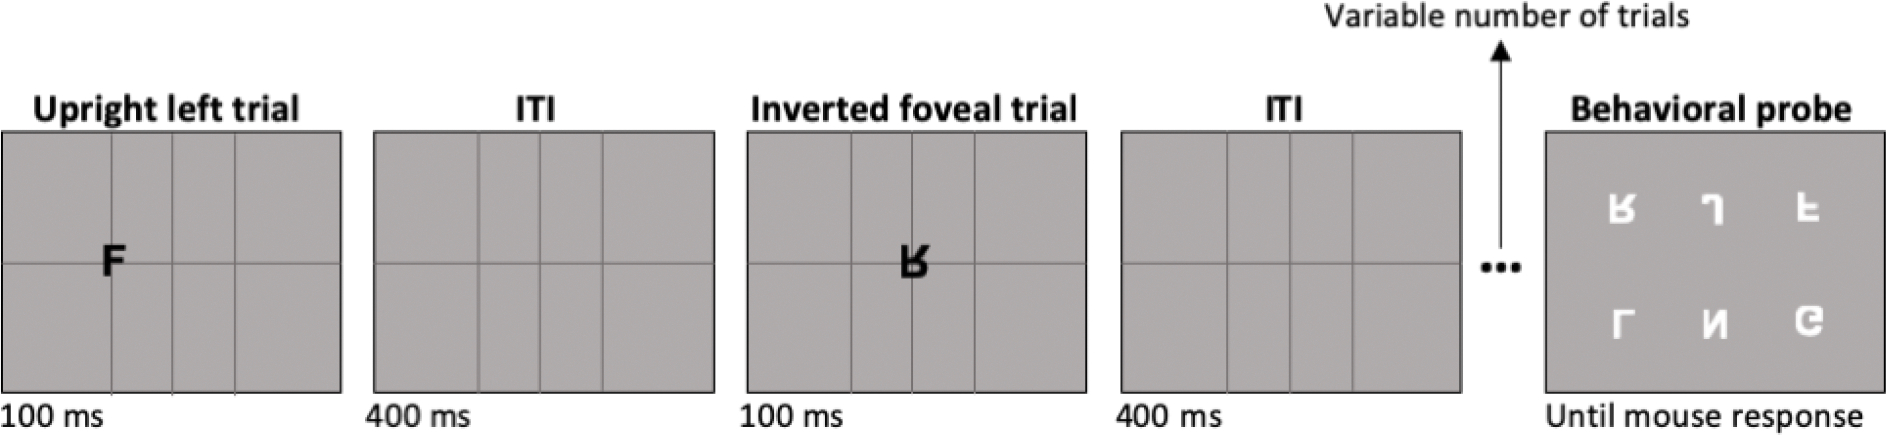
Trial schematic. Participants viewed a sequence of upright and inverted letters in random order. After a random number of letter presentations, a behavioral probe array appeared, and the participant was required to click on the letter in that array that matched the identity of the immediately preceding letter. The letters in the behavioral probe array were upright if the preceding letter was upright, and they were inverted if the preceding letter was inverted. The sequence of individual letter presentations then resumed.
The letters in the behavioral probe array were upright if the preceding letter was upright, and they were inverted if the preceding letter was inverted. Subjects used a mouse to click on the stimulus that matched the target from that trial. After response, the background lines reappeared, and a shrinking circle at the center of the screen drew the participant’s attention back to the fixation point for 1200 ms, followed by the ITI screen and then the next trial. Each participant was probed 18 times in each block of 360 trials, for a total of 216 probes across the 12 blocks. These were shuffled such that there were no fixed number of how many trials passed before being probed, but on average it would be 20 trials (corresponding to 10 seconds), with a maximum of 39 trials between probes.
In this task, chance was 1/6 (16.7%). As a quality control measure, participants were excluded from all analyses if their accuracy in selecting the probe letter was less than 4/6 (66.7%). Six participants were replaced for this reason.
Behavioral data analysis
Behavioral performance on probe trials were modeled using logistic linear mixed effect regression as implemented by the lme4 R package (Bates, et al., 2014). The response variable was whether each of the 216 probe trials was answered correctly (1) or incorrectly (0). The fixed effect structure of the model included effects for Familiarity (upright vs. inverted letters), Location (foveal, left, right), and the interaction between the two. These variables were dummy coded, with upright foveal letters serving as the reference group. The random effect structure included random intercepts for Stimuli (each of the 12 letter stimuli), random intercepts for Subject, and by-subject random slopes for Familiarity and Location. Effect significance was tested with Wald chi-square tests using Satterthwaite’s method through the lmerTest package (Kuznetsova, Brockhoff, and Christensen, 2017). All tests used an alpha of .05.
EEG Recording and Processing
The EEG was recorded from 32 sites using a Brain products actiCHamp system. This included electrodes at 27 scalp sites (FP1, FP2, F3, F4, F7, F8, C3, C4, P3, P4, P5, P6, P7, P8, P9, P10, PO3, PO4, PO7, PO8, O1, O2, Fz, Cz, Pz, POz, Oz), electrodes on the left and right mastoids, an electrode placed below the right eye, and electrodes placed lateral to the left and right eyes. Impedances were kept below 25 kΩ. EEG was recorded at 500 Hz using a cascaded integrator-comb anti-aliasing filter with a half power cut of at 130 Hz. Offline, data were processed using the Matlab packages EEGLAB (Delorme & Makeig, 2004) and ERPLAB (Lopez-Calderon & Luck, 2014). Event codes were shifted forward 28 ms to account for stimulus monitor presentation delay. The data were then down sampled to 250 Hz and filtered using a noncausal Butterworth bandpass filter (0.1 – 30 Hz) with a 12 dB/octave roll off.
To aid in eye-movement artifact rejection, we created a bipolar HEOG channel (a subtraction of horizontal left and right eye channels) and a bipolar VEOG channel (a subtraction of FP2 and lower eye channels). Periods of extreme EEG voltages were removed from the continuous data, then the data from the original channels were decomposed using independent component analysis. Components determined to be blinks on the basis of their time course and scalp distribution were removed from the data, and then the EEG was reconstructed.
The EEG was then re-referenced to the average of all scalp electrodes and was epoched from −100 to 400 ms relative to stimulus onset. Then, artifact rejection was performed on all channels, rejecting trials with extreme values in any channel. Trials containing artifacts were excluded from both the averaged ERP analysis and the decoding analysis. Participants who had fewer than 90 (out of 120) remaining trials for any item-by-condition combination (e.g., upright “F” trials in the foveal condition) were excluded from further analysis to ensure sufficient trial numbers for the decoding analysis. This reflects an a priori policy of excluding participants for whom more than 25% of trials are rejected (Luck, 2014), but updated for decoding studies to apply to every item-by-condition combination. We replaced 1 participant for this reason. Overall, the remaining trial counts were high (Mean = 96.6%), and consistent across conditions (ranging from 96.4% to 96.7%).
Univariate ERP analysis
Averaged ERPs were created over the epoch of −100 to 400 ms, using the prestimulus period as the baseline. These averages collapsed across the individual letter identities, separately for upright and inverted letters. Following from previous N170 studies, our univariate analyses focused only on posterior-occipital electrodes. We used two symmetrical clusters of electrodes, averaged into one cluster for the left channels (P7, P9, PO7, O1) and one for the right channels (P8, P10, PO8, O2). This followed the recommendations of Zhang and Kappenman (2024), who systematically varied the cluster size used to analyze N170 data and found that larger clusters including these channels yielded higher signal to noise ratios than smaller clusters or single channels.
The ERPs for upright and inverted letters were compared separately for the left and right hemisphere clusters, due to the possible timing differences according to contralateral and ipsilateral presentation. Statistical analyses used a mass univariate approach (Groppe, Urbach, & Kutas, 2011), conducted on the difference wave between upright and inverted letters (inverted minus upright). In this analysis, two-tailed, one-sample t-tests were performed against 0 at each time point (every 4 ms) in the analysis window, and corrected for the false discovery rate (FDR) using the method of Benjamini and Hochberg (1995). Our time window for both the averaged ERP analysis and the decoding analysis started at 64 ms and extended to 300 ms. The start time of this window was chosen as the time at which the location of the stimulus could first be decoded (as explained below) and represents the earliest possible time at which we could expect to detect a difference between upright and inverted letters. The end time of the window (300 ms) was chosen to include the full extent of possible N170 effects, and is typically the latest end-point for measurement windows used by studies of the orthographic N170 (see supplemental table 2 of Amora et. al., 2022 for review of time windows in the N170 literature).
ERP decoding analysis
The main focus of the decoding analyses was to classify which of the six letters was presented, separately for each combination of upright and inverted letters and the 3 locations (Left, Foveal, Right). Multiclass decoding was conducted using linear support vector machines (see Carrasco et al., 2024; Zhang et al., 2024, Bae & Luck, 2018). Specifically, we used the scikit-learn “SVC” implementation (based of the LIBSVM library; Chang and Lin, 2011) with a one vs. one classification scheme and the C parameter set to 1. The decoders were trained to distinguish among the different letters on the basis of the pattern of amplitudes across electrodes at a single time point. Trials with artifacts were excluded.
Decoding was performed separately at each time point for each subject. The decoding used an iterative cross-validation approach, in which decoding accuracy was averaged across a large number of training/testing folds and iterations. For a given iteration, the trials for each letter were randomly and evenly subdivided into three sets, and then the trials from a given set were averaged together, yielding three separate averages for each letter. For analyses comparing upright and inverted letters, the number of trials per average was balanced such that the same number of trials was used for decoding each upright or inverted letter. For one fold of a given iteration, two of the averages for each letter were used to train the decoder and the remaining average for each letter was used to test the decoder. For each of the test cases, the decoder attempted to guess the letter from the pattern of voltages across the scalp, and the number of correct and incorrect guesses to determine the proportion correct. Because there were six letters, chance was 1/6 (0.1667).
This process was repeated for three folds, cycling through which averages were used for training and which averages were used for testing. The three-fold process was then repeated with new decoders for each time point in the ERP (from −100 ms to 400 ms in steps of 4 ms). This entire process was then iterated 100 times, with a new random assignment of trials to averages for each iteration, and accuracy was averaged across folds and iterations to yield the decoding accuracy for that subject and time point.
This analysis was run separately for each combination of location and familiarity condition (upright or inverted). Additionally, to examine possible differences in the information present between the left and right hemispheres for letter decoding, we conducted the same decoding analysis using the data from only the left channels (FP1, F3, F7, C3, P3, P5, P7, P9, PO3, PO7, O1) or only the right electrode channels (FP2, F4, F8, C4, P4, P6, P8, P10, PO4, PO8, O2).
To test whether the mean decoding accuracy across participants was above chance for a given condition, the accuracy for each time point in the analysis window was tested against chance (0.1667) using one-sample t-tests. These tests were one-tailed because only noise can produce below-chance values in this specific analysis. To test whether decoding accuracy was different between upright and inverted letters, the decoding accuracy for each condition at each time point was compared using paired-sample two-tailed t-tests. As with the univariate analysis, we performed an FDR correction for multiple comparisons with an analysis window of 64 ms – 300 ms.
The start time of the analysis window for both the univariate and decoding analyses was chosen as the first time point at which the location of the stimulus (left, foveal, right) could be decoded significantly above chance. Because stimulus location is so robustly encoded in visual cortex, this serves as an estimate of the arrival of sensory information to visual cortex, and it should be the earliest point at which the identity of the stimuli should be decodable. Location decoding accuracy was determined using the same decoding procedure described above, except that the stimuli were divided according to location rather than identity. Statistical significance was tested using one-sample, one-tailed t tests on all time points between 0 and 300 ms, and the time point that was first significant after FDR correction was 64 ms. The location decoding results are shown in Figure 2.
Figure 2.
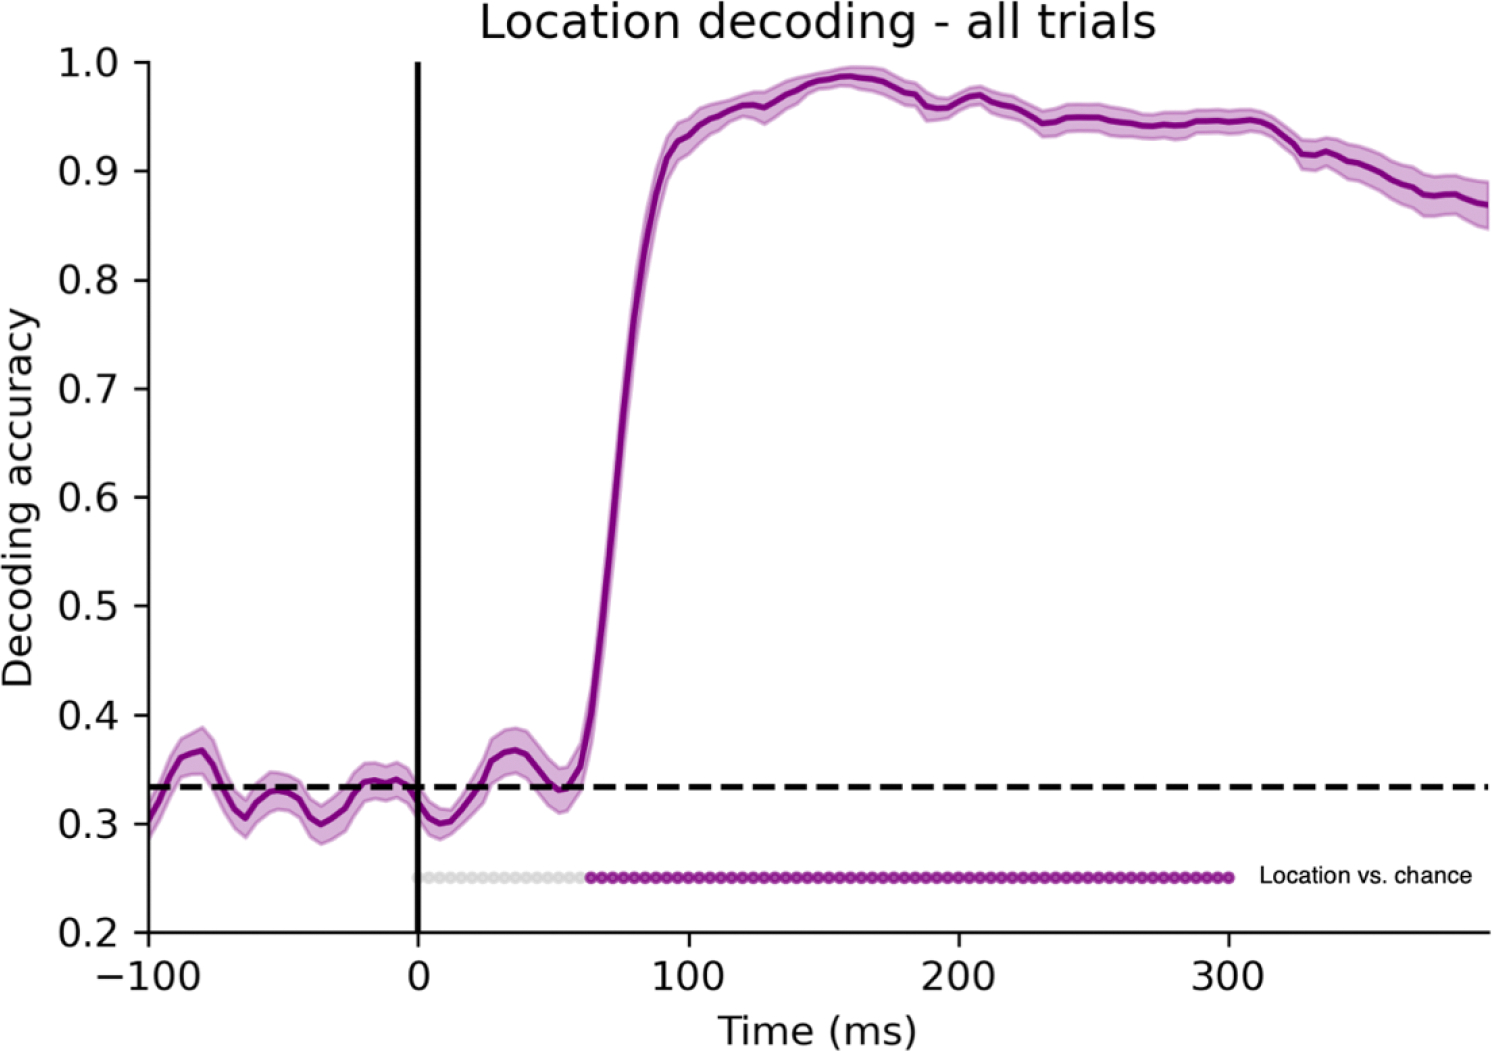
Location decoding results. Stimulus location (Foveal, Right or Left) could be decoded significantly better than chance starting at 64 ms, representing an estimate of the arrival of information in visual cortex. Significance was tested from 0 to 300 ms, FDR corrected. Significance for each time point is marked with filled-in dots at the bottom of the plot.
Results
Behavioral probe accuracy results
Behavioral accuracy for the probe trials is summarized in Figure 3. We found a significant effect of Location, with higher accuracy for foveal probes compared to left or right probes, X2 (2, N = 30) = 37.62, p < .001. We also found a marginally significant effect of Condition, with upright letters showing higher accuracy than inverted letters, X2 (1, N = 30) = 3.19, p = .074. The interaction between Condition and Location was not significant (p = .306). To test whether accuracy differed significantly between letters in the right and left locations, we conducted an analysis with an identical structure except without the foveal letters. There was no significant difference between the left and right locations (p = .271) and again no significant interaction between Condition and Location (p = .596).
Figure 3.
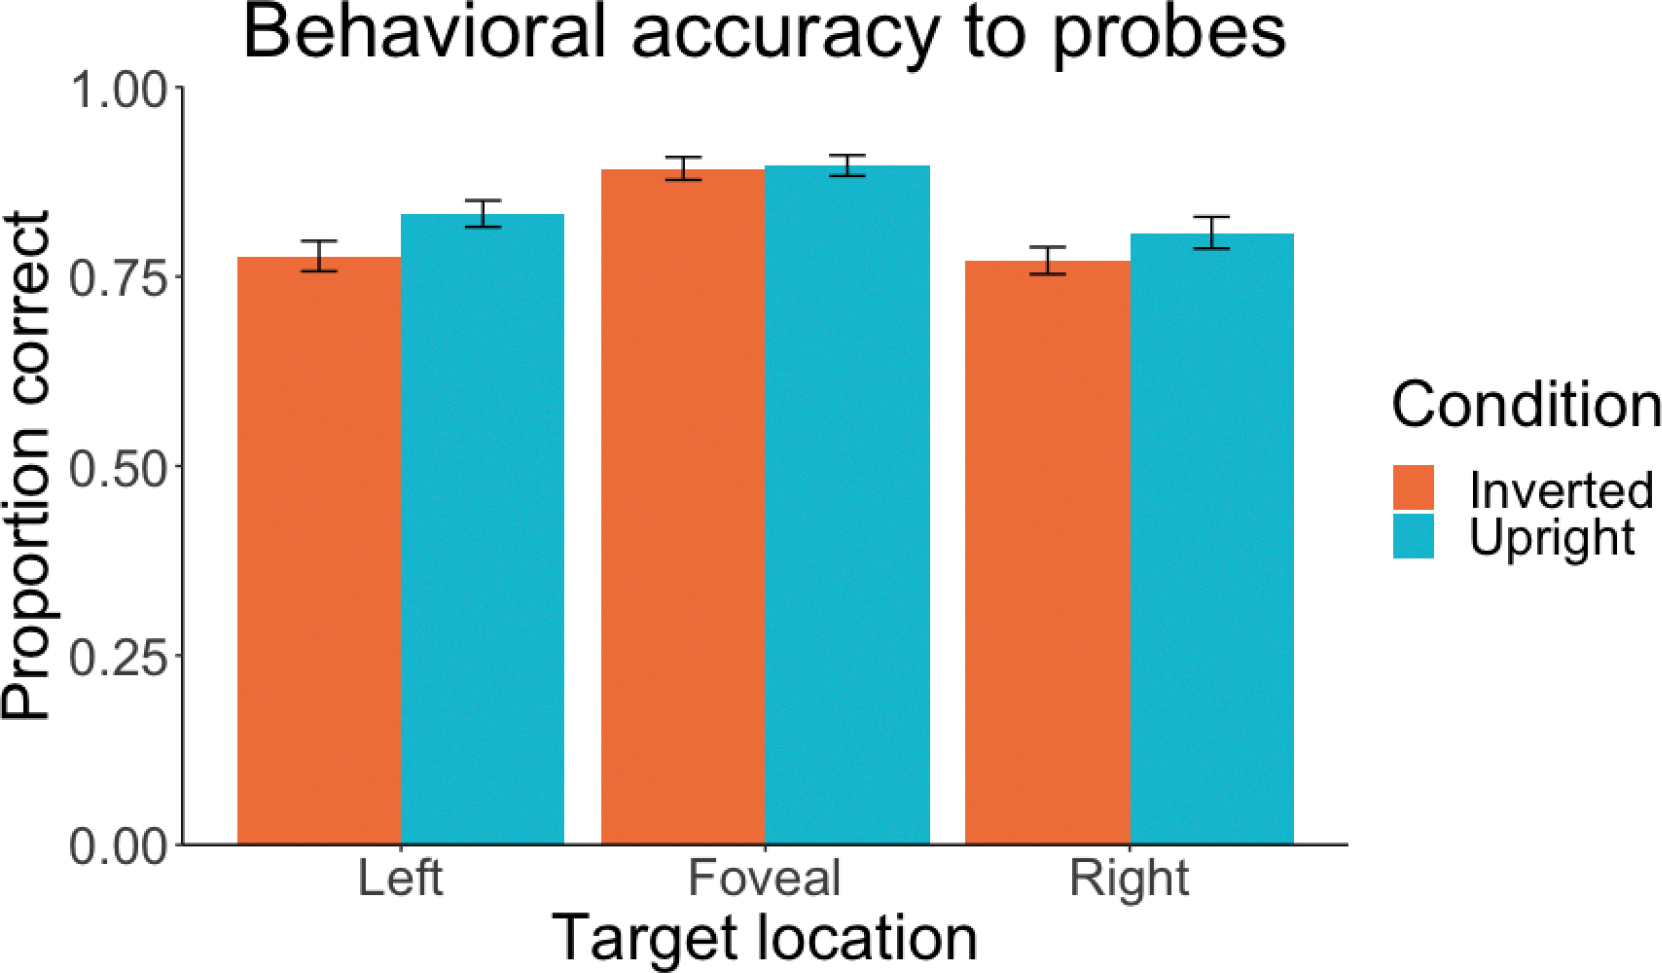
Proportion correct for the behavioral probes that were randomly distributed throughout each session. Participants were required to report the identity of the letter that occurred immediately prior to a given probe. Chance was 1/6 (0.1667). Error bars represent +/− 1 SEM
Univariate ERP results
Although the multivariate decoding analyses were the key tests of our primary hypothesis, they are more easily understood within the context of overall ERP amplitudes. We therefore begin by presenting the univariate analyses of averaged ERP amplitudes, collapsed across the individual letter identities. The averaged ERPs are shown in Figure 4a–f, and difference waves (inverted minus upright) are shown in Figure 4g–h. In the parent waveforms, a slightly larger P1 can be seen for inverted letters than for upright letters for the foveal and right stimulus locations, especially in the left hemisphere electrode cluster (Figures 4a and 4c). The N170 was also clearly larger for inverted letters than for upright letters, especially for foveal stimuli (Figures 4a and 4b). These effects can be seen more clearly in the inverted-minus-upright difference waves (Figures 4g and 4h). In the P1 latency range, the amplitude of the inverted-minus-upright difference for foveal stimuli was larger in the left hemisphere than in the right hemisphere, and the difference for lateralized stimuli was larger in the contralateral hemisphere than in the ipsilateral hemisphere. In the N170 latency range, by contrast, the difference for foveal stimuli was larger in the right hemisphere than in the left hemisphere. For lateral stimuli, the N170 difference was larger in the contralateral hemisphere than the ipsilateral hemisphere.
Figure 4.

Univariate ERPs in posterior left and right electrode clusters for upright versus inverted letters presented in the fovea (a,b), in the right visual field (c,d), and in the left visual field (e,f). Inverted-minus-upright difference waves for each location in the left (g) and right (h) electrode clusters. Colored dots beneath the difference waves mark time points when the difference between inverted and upright letters was significantly different from zero (FDR corrected). Grey dots indicate time points that were tested (64 – 300 ms) but were not significant.
For the statistical analysis, we will begin by considering the effects in the P1 latency range (ca. 80–150 ms). In this time period, the voltage for foveal stimuli was significantly more positive for inverted letters than for upright letters in both the left and right clusters, beginning at 108 ms. For lateralized letters over the contralateral hemisphere, the voltage was also significantly more positive for inverted than for upright letters, but this began slightly later – starting at 116 ms in left channels and at 120 ms in right channels. As expected due to contralateral dominance and the hemispheric transfer time, this effect was smaller and later over the ipsilateral hemisphere, with a P1 effect in the left hemisphere cluster for letters in the left visual field starting at 152 ms and no significant P1 effect in the right hemisphere cluster for letters in the right visual field.
Now we turn to the statistical analysis in the N1 latency range (ca. 150–250 ms). In this time period, the N170 was significantly larger (more negative) for inverted than for upright stimuli for both the left and right clusters and for all location conditions. For both foveal and contralaterally presented stimuli, this effect became significant in left channels at 164 ms and slightly earlier in right channels at 156 ms. For ipsilaterally presented stimuli, the N170 effect began at 180 ms in the left hemisphere and again slightly earlier in the right hemisphere at 172 ms. These effects in the N170 latency range remained significant in all conditions until approximately 230 ms.
ERP decoding results
Next we used ERPs from all scalp electrodes to decode the exact letter identity, separately for upright and inverted letters at each of the three spatial locations. The decoding accuracy time series are shown in Figure 5. Note that we also conducted exploratory analyses in which we decoded whether the letters were upright versus inverted, collapsed across letter identity (see Appendix).
Figure 5.

Decoding time series for upright and inverted letters in the fovea (a), right visual field (b) and left visual field (c). Colored dots beneath the waves mark time points when decoding accuracy for inverted and upright letters was significantly higher than chance (1/6). Stacked colored dots indicate time points when there was a significant difference in decoding accuracy between upright and inverted letters, with the color on top indicating which condition had the higher decoding. Grey dots indicate time points that were tested (64 – 300 ms) but were not significant. All tests were FDR corrected.
Foveal letters (Figure 5a)
For stimuli presented in the fovea, upright letter identity could be decoded significantly above chance starting at 80 ms, just 16 ms after the location of the stimuli could be decoded (see Figure 2) and well before any significant differences between upright and inverted letters were observed for the averaged ERP amplitudes (see Figure 4). The 64 ms time point also showed significant upright letter decoding, but since it was a single isolated point, we have more confidence that 80 ms is the true onset of upright letter decoding. For inverted letters, stimulus identity became significantly decodable later, at 100 ms. Moreover, decoding accuracy was significantly greater for upright letters than for inverted letters at the 92 and 96 ms time points. Thus, upright foveal letters could be decoded quite rapidly—well before 100 ms—and they could be decoded more accurately than inverted letters before 100 ms.
Decoding accuracy for both upright and inverted letters in the foveal location remained above chance until the final time point of the analysis window at 300 ms. Starting at 136 ms, however, decoding accuracy was significantly greater for inverted letters than for upright letters, and this difference remained significant until the end of the analysis window at 300 ms (except for a single time point at 264 ms).
Note that the univariate and decoding patterns were opposite during the P1 time range, with greater P1 amplitude but lower decoding accuracy for inverted compared to upright letters. In contrast, the univariate and decoding patterns were in the same direction during the N170 time range, with both greater decoding accuracy and a larger N170 for the inverted letters than for the upright letters.
Right visual field letters (Figure 5b)
We observed a similar pattern for stimuli in the right visual field: upright letters were decoded above chance starting at 80 ms, whereas decoding accuracy for inverted letters was not significantly above chance until 44 ms later, at 124 ms. Moreover, decoding accuracy was significantly greater for upright letters than for inverted letters from 80–96 ms. Decoding for both upright and inverted letters remained above chance until 300 ms. Starting at the 176 ms time point, decoding accuracy was significantly greater for inverted letters than for upright letters, and this effect remained until the final time point in the analysis window.
Left visual field letters (Figure 5c)
In the left visual field, a slightly different pattern of early effects emerged. Both upright letters and inverted letters were decodable early, starting at 80 ms for upright letters and slightly later at 88 ms for inverted letters, and decoding accuracy did not differ between upright letters and inverted letters in this early time period. Decoding remained significantly above chance for both upright and inverted letters through 300 ms. As with the other locations, decoding accuracy at later time points was significantly greater for inverted letters than upright letters. This effect became significant at 152 ms and remained significant throughout the analysis window except for two brief periods (164–176 ms and 188–192 ms).
ERP decoding results split by hemisphere
To test for differences between the left and right hemispheres in the neural information about letter identity, we conducted the same decoding analyses separately for left and right hemisphere electrodes. Although EEG signal may be volume-conducted from one hemisphere to electrodes in the opposite hemisphere, and neural signals generated in one hemisphere may be decodable from the voltages in the opposite hemisphere, it is reasonable to assume that the decoding accuracy for electrodes over one hemisphere will reflect processing in that hemisphere at least somewhat more than processing in the opposite hemisphere. The results are shown in Figure 6.
Figure 6.

Decoding time series obtained separately from left- and right-hemisphere channels for upright and inverted letters in the fovea (a,b), right visual field (c,d) and left visual field (e,f). Colored dots beneath the waves mark time points when decoding accuracy for inverted and upright letters was significantly higher than chance (1/6). Stacked colored dots indicate time points when there was a significant difference in decoding accuracy between upright and inverted letters, with the color on top indicating which condition had the higher decoding. Grey dots indicate time points that were tested (64 – 300 ms) but were not significant. All tests were FDR corrected.
Foveal letters
For the foveal location, left channels (Figure 6a) showed the same pattern of early effects as in the full montage decoding, with significant decoding starting at 76 ms for upright letters but not until 100 ms for inverted letters, and a significant difference between them at the 92 and 96 ms time points. Channels over the right hemisphere (Figure 6b) did not show this early effect for foveal letters. In these channels, significant decoding was observed for upright letters beginning at 92 ms and for inverted letters onset beginning at 100 ms, but decoding accuracy was not significantly greater for upright letters than for inverted letters in the early time period. Thus, to the extent that electrodes on a given side reflect the information in the underlying hemisphere, these results indicate that information about letter identity is extracted earlier by the left hemisphere than by the right hemisphere and that the advantage for upright over inverted letters is primarily present in the left hemisphere.
As was observed for the foveal location when all channels were used, decoding for upright and inverted letters remained significant for both right and left channels until the end of the analysis window at 300 ms, and decoding accuracy eventually became significantly greater for inverted letters than for upright letters. This effect began earlier in the right hemisphere at 128 ms compared to 144 ms in the left hemisphere. Higher decoding accuracy for inverted letters also persisted longer in the right hemisphere, lasting until 300ms (except for short span between 144–152 ms), while the same effect was significant for the last time at 252 ms in the left hemisphere.
Right visual field letters
Upright letters presented in the right visual field also showed early above-chance decoding for the left (contralateral) hemisphere electrodes (Figure 6c), with a brief point of significant decoding at 84 ms and then consistently significant decoding starting at 92 ms. By contrast, inverted letters in the right visual field did not show above-chance decoding in these electrodes until 132 ms, and decoding accuracy was significantly greater for upright than inverted letters between 80 and 92 ms and then again at 108 ms (Figure 6c). In the right hemisphere (ipsilateral) channels (Figure 6d), we did not observe these early differences between upright and inverted letters in the left visual field; instead inverted letters were first decodable at 128 ms, upright letters at 140 ms. These results provide further evidence that the early advantage for upright over inverted letters is primarily present in the left hemisphere.
Upright and inverted letters in the right visual field were decoded above chance for both right and left hemisphere channels until the final time point. However significantly greater decoding for inverted than upright letters onset at 176 ms in the right hemisphere channels while in the left hemisphere channels this effect onset at 208 ms.
Left visual field letters
For letters presented in the left visual field, we observed no early difference in decoding between upright and inverted letters in either the left or right hemisphere electrodes (see Figure 6e–f). In the right (contralateral) channels, upright letters did show early above-chance decoding, starting at 68 ms, whereas above-chance decoding for inverted letters did not start until 84 ms. However there was no significant difference in decoding accuracy between upright and inverted letters in these early time points. Decoding accuracy for inverted letters in the left visual field was significantly above chance in the left electrodes starting at 96 ms and lasting until the end of the analysis window. Interestingly, upright letters on the left side were not decodable in these channels until 156 ms, and this decoding remained above chance until 272 ms. These results again suggest that there is little or no early decoding advantage for upright over inverted letters for stimuli presented in the left visual field. Note that this contrasts with the univariate P1 wave, which showed a large effect of stimulus inversion for stimuli in the left visual field, especially for the right hemisphere electrode cluster (Figure 4h).
In the right hemisphere channels inverted letters had significantly higher decoding accuracy than upright letters from 160 ms until the end of the analysis window. In the left hemisphere channels decoding accuracy was significantly higher for inverted letters than for upright letters for these channels in a window between 140 ms and 152 ms, and then from 192 ms until the end of the analysis window.
Discussion
Years of intensive reading experience might be expected to alter the tuning of sensory processing, allowing the visual system to more rapidly extract the visual features needed to discriminate letter identities. To test this hypothesis, we measured early visual ERP activity in response to single upright and inverted letters presented in the fovea and in the right and left parafovea. Using classical univariate ERP analyses, we found that upright and inverted letters were differentially processed beginning shortly after 100 ms, with a more positive voltage during the P1 latency range and a more negative voltage during the N170 latency range for inverted compared to upright letters. Although these univariate differences indicate that upright and inverted letters are processed differently in these time ranges, they do not indicate whether the brain actually extracts more information related to letter identity for upright letters or for inverted letters. We therefore used a multivariate pattern analysis approach to “decode” the different letter identities from the pattern of voltage across the scalp at each time point.
Our hypothesis predicts that decoding accuracy for classifying the individual letter identities should be greater for upright letters than for inverted letters, beginning at a short latency. Indeed, we found that decoding accuracy prior to 100 ms was significantly greater for upright letters compared to inverted letters. In other words, the early neural signal contained more information about letter identity for upright letters than for inverted letters, beginning within 30 ms of the time at which information about stimulus location could be decoded (which plausibly reflects the time at which stimulus information arrived in the cortex). These effects were particularly robust for letters presented in the fovea and right parafovea, as would be expected given the important roles of these stimulus locations in reading Latin scripts. Further, these decoding effects were especially evident for electrodes over the left hemisphere, as would be expected given prior evidence for specialization of text processing in the left visual cortex (e.g., Dehaene et al., 2010; Maurer & McCandliss, 2007). Because most readers of Latin scripts have vastly more experience perceiving upright than inverted letters, but these two classes of letters are otherwise nearly identical, these results provide evidence in favor of the hypothesis that reading experience leads to improved tuning of relatively early visual processes that allows information relevant to discriminating among letters to be extracted more efficiently.
These conclusions build on prior research on perceptual learning in the visual system. Shorter-term practice on a range of laboratory tasks leads to changes in cortical processing that optimize the extraction of visual information relevant for the practiced task (see Li, 2016). Experience with visual behaviors over longer time scales also alters perceptual processing more generally. For instance, experience playing action video games has been shown to increase performance on various visual tasks, though these effects are typically thought of as mediated by top-down attentional control (e.g. Chopin, Bediou, and Bavelier, 2019). In the case of reading alphabetic scripts, literate adults have recognized strings of letters millions of times—amounting to an extreme amount of practice for discriminating between specific, highly-similar visual stimuli. Our results suggest that the magnitude and specificity of this extensive visual experience is sufficient to produce changes in the sensory processing of letters, such that even relatively low levels of the visual system are optimized for reading. This is consistent with behavioral evidence that reading experience allows upright letters to be identified accurately in the face of crowding from adjacent letters (Winsler & Luck, 2025).
Relationship to univariate ERP effects
We supplemented these decoding analyses with traditional univariate analyses that compared the amplitude of the signal for upright versus inverted letters, averaging over letter identity. We found that the P1 wave was larger (more positive) for inverted letters than for upright letters, consistent with prior research showing that mirror-reversed letters elicit larger P1s than non-reversed letters (Blackbourne et al., 2014). We found that the N170 component was also larger (more negative) for inverted letters than for upright letters, again aligning with previous research which shows this same pattern for mirror-reversed letters (Blackbourne et al., 2014) and inverted words (e.g. Rossion et al., 2003). However, the decoding pattern was opposite during the P1 and N1 latency ranges, with greater decoding accuracy for upright letters during the P1 time period but greater decoding accuracy for inverted letters during the N170 time period.
The fact that decoding accuracy was reduced rather than enhanced for inverted stimuli during the P1 time window suggests that the enlarged P1 amplitude for inverted stimuli does not reflect more efficient processing of these stimuli. Instead, the greater P1 amplitude for inverted stimuli may indicate degraded processing that produces larger non-specific signals or increased attentional engagement. However, we cannot be certain that the more positive voltage observed for inverted relative to upright stimuli during this time period actually reflected an increase in the amplitude of a single underlying P1 source. Instead, the more positive voltage for inverted letters could reflect a decrease in the amplitude of an overlapping negative source, or it could reflect partial cancellation of the P1 by the overlapping N170. That is, given that inversion delays the N170 during word or face processing (Rossion et al., 2003), it may be the case that upright letters appear to have smaller P1s because the N170 begins sooner for upright than inverted letters. This ambiguity shows yet again that traditional univariate analyses can be difficult to interpret.
Both N170 amplitude and decoding accuracy during the N170 time period were greater for inverted letters than upright letters. This result suggests that larger amplitude N170s to inverted letters reflects enhanced processing of stimulus identity. This further suggests that the generation of larger N170s is not because of the recruitment of neurons auxiliary to the stimulus representation (e.g., general attentional processes or nonspecific signals), but rather because of processes that yield a greater amount of discriminable stimulus information. The finding that decoding accuracy was greater for the less-familiar stimulus category (inverted letters) may indicate that representing inverted letters requires longer-lasting or more-in-depth processing, which in turn causes the activation of more stimulus-specific information that is detectable in the EEG signal during the N170 time window. Relatedly, predictive coding frameworks would predict that less-familiar stimuli could produce larger prediction errors, which—if specific enough to encode identity-related information—may also contribute more decodable signals.
Although we only tested upright and inverted letters, given that the pattern of univariate N170 inversion effects we observed for single letters was similar to what others have observed with words and faces (Rossion et al., 2003), we speculate that other stimulus classes would show a similar correspondence between larger N170s and greater decoding accuracy. However, we caution that we cannot be certain that the greater decoding accuracy we observed for inverted relative to upright letters during the N170 time period reflects the same processes that produce the N170 component. Linking the univariate effects directly to the decoding effects would require additional research. Further, it should be noted that that many manipulations produce orthographic N170 effects, both at the word level (reviewed in Amora et al, 2022) and at the level of single letters, as was found in the current study and others (Stevens et al., 2013; Toussi et al, 2023). This variability likely reflects tuning for orthographic stimuli at multiple levels of detail (e.g. see Zhao et al., 2014). Future studies using a combination of isolated letters, non-word letter strings, and words may be useful for detangling the contributions of letter-level and word-level processing to the generation of the orthographic N170.
Role of stimulus location and hemisphere
As reviewed earlier, we expected that letter identities would be preferentially processed in the fovea and the right parafovea relative to the left parafovea, and we also expected that the left hemisphere would play a greater role than the right hemisphere. The results were broadly consistent with these expectations. In particular, decoding accuracy during the P1 latency range was significantly greater for upright than inverted letters for stimuli at the foveal and right parafoveal locations but not for stimuli at the left parafoveal location.
The finding that this early decoding advantage for upright letters was present only for stimuli in the fovea and right visual field is consistent with the interpretation that this difference in early decoding accuracy was a result of reading experience. Although reading relies heavily on the fovea, readers also extensively sample orthographic information from upcoming words in the parafovea (Schotter et al., 2012). For readers of Latin scripts, which are read from left-to-right, this span extends approximately 15 character spaces to the right of fixation compared to only 4 spaces to the left of fixation (see Rayner, Slattery and Belanger, 2010). Hence, this may bias the tuning of letter representations towards the right visual field, potentially contributing to the difference we observe in early decoding between the left and right locations.
Another clue about the nature of this tuning may be found in the decoding analyses conducted separately for electrodes over the left and right hemispheres. In these analyses, we observed significant differences in early decoding between upright and inverted letters only in the left-hemisphere channels, which may reflect the left-lateralized nature of language processing. Indeed, the left lateralization of N170 is thought to result from processing in left-lateralized language regions such as the VWFA, although there is limited direct evidence for this (see Blackbourne et al., 2014 for one example). Fast feedforward signals during the early visual processing of upright letters may begin to activate higher level letter representations in left ventral-occipital areas like VWFA as early as 80 ms. This would be fast, but not unprecedented – for instance, intracranial recordings in monkeys shows feedforward information can flow from V1 to inferior-temporal cortex in about 25 ms (Schroeder et al., 1998), and similarly in humans, information can flow from occipital to frontal cortex in about 25 ms (Foxe & Simpson, 2002).
However, it is also possible that the present differences in decoding from left- and right-hemisphere electrodes might instead be related to stimulus side and reading direction, because information from the right visual field first projects to left visual cortex. Based only on the current results, we cannot distinguish whether the hemisphere differences we observed was an effect of reading direction, an effect of left lateralization for language, or a mixture of both. Future research using a similar design but with readers of a right-to-left language such as Arabic or Hebrew would help to disambiguate the contributions of reading direction and language lateralization to visual tuning for letters.
Broader issues and limitations
The use of multivariate decoding analyses in this study provided important information beyond what is available using classical univariate ERP analyses alone. In addition to being more sensitive—uncovering differences in the ERP time course between upright and inverted letters about 20 ms earlier than the univariate analyses—the decoding analyses also provided a key advance in interpretability, allowing us to quantify differences in the amount of information present about upright versus inverted letter stimuli at each point in the EEG signal. However, interpreting differences in decoding accuracy as reflecting differences in information content requires some assumptions.
One assumption is that the trial-by-trial variance in the EEG data due to external factors (e.g., muscle noise or stimulus-nonspecific brain activity) is consistent for upright and inverted letters. Given that all conditions and stimuli were distributed across the experiment, we believe this is a safe assumption because any source of intertrial variability (e.g., due to attentional lapsing) would be equally likely to affect all conditions. However, it is possible that there are meaningful differences in trial-by-trial variance in bona fide neural signals between upright and inverted letters as a result of experience. For instance, neural signals may be more consistent across trials for familiar stimuli such as upright letters, and this could explain the greater decoding accuracy for upright than inverted letters in the P1 period. Even if this were the explanation of the present results, it would still be evidence for experience-driven changes in early sensory processing, which would not change the main conclusion of the present study.
Another assumption is that there was no other source of information present in the stimuli themselves that could explain differences in decoding between upright and inverted letters except for the effect of experience. For instance, if there was a larger range of luminance among items in one set relative to the other, this could explain higher decoding accuracy for that set. However, because of the high degree of visual similarity between the upright and inverted letters, it is nearly certain that the observed differences between upright and inverted letters in univariate ERPs or decoding accuracy was a result of the participants’ experience reading upright letters. That is, upright and inverted letters and differed only by a transformation (inversion) that was identically applied to all letters in the inverted condition. This means that the relative degree of similarity or dissimilarity with regard to any basic visual feature (e.g. luminance, spatial frequency, orientation, perimetric complexity) between members of the set of inverted letters was identical to those in the set of upright letters. The difference between the two sets lies solely in the fact that the way these features were combined either did or did not match stimuli that were extensively learned through reading. Hence, the greater decoding accuracy for upright than for inverted letters within the first 100 ms after stimulus onset provides strong evidence that experience with reading leads to a tuning of early visual processes to differentiate among upright letters.
Finally, it is important to note that the fact that letter identity can be decoded from the neural signal prior to 100 ms does not imply that the brain has explicitly recognized the identities of the letters by this time. It simply means that the different letters produced discriminably different patterns of brain activity during this time period. However, the fact that decoding accuracy was significantly greater for upright letters than for inverted letters during this time range indicates that our participants’ extensive experience with upright letters has changed the visual tuning properties of their neural circuits in a way that produces greater differentiation in the patterns of neural activity for the upright letters than for the inverted letters. This presumably gives upright letters an advantage in later processes that produce explicit recognition of letters and words.
Acknowledgments
This study was made possible by grant R01EY033329 from the National Institutes of Health.
Appendix
In the main body of the manuscript, we reported a set of univariate analyses which show that inverted letters elicit larger P1s and N170s compared to upright letters. We also reported a set of analyses in which we decoded the specific identity of each stimulus and found that upright letters could be decoded with higher accuracy than inverted letters early in the ERP time course (in some cases by about 80 ms). At longer latencies, however, decoding accuracy was higher for inverted letters. It is important to note that the univariate analyses of P1 and N170 amplitude and the decoding methods provided different information. The univariate analyses indicated when, on aggregate, upright and inverted letters produced different ERP amplitudes. The decoding analyses indicated when there was information about letter identity in the ERP signal, and whether the amount of information was greater for upright letters or for inverted letters. Decoding methods can also be used to compare ERP amplitudes, sometimes providing more statistical power than univariate methods (Carrasco et al., 2024). To assess whether decoding might be more sensitive than univariate methods in determining whether upright and inverted stimuli produce different ERP amplitudes, we conducted an exploratory analysis in which we decoded the inversion condition itself. That is, we decoded whether the letter was inverted or upright, not what the exact letter was. This analysis was more comparable to the univariate analyses.
The approach for this decoding analysis was identical to the approach described in the manuscript, except that we decoded whether the stimulus was upright or inverted, ignoring the exact letter identity. As with the main decoding analyses, we conducted this analysis separately for each stimulus location (left, foveal, right). Significance was tested in the same way, using FDR-corrected, one-tailed t-tests against chance, which for this analysis was 0.5. The results are shown below, in figure A1.
Figure A1.

Decoding accuracy for stimulus inversion (upright letters or inverted letters) for each of the locations (left, foveal, and right). Colored dots beneath the waves mark time points when decoding accuracy was significantly greater than chance (1/2) for that location. Grey dots indicate time points that were tested (64 – 300 ms) but were not significant. All tests were FDR corrected.
The inversion condition was decoded quite well, peaking at almost 90% correct for foveal stimuli. Note that the decoder for this analysis had six times as much data per class than the letter decoding analyses (up to 720 trials per class, per location, per participant), which may have contributed to the higher decoding accuracy. For all locations, inversion decoding peaked during the time range of the N170 component, from about 180–210 ms. This fits with the univariate results, which also showed the largest differences between upright and inverted letters during this time.
Inversion became significantly greater than chance at the shorted latencies for foveal stimuli earliest, starting at 96 ms, followed by stimuli in the left visual field at 120 ms, and stimuli in the right visual field at 128 ms. This parallels the onset of significant differences between upright and inverted letters found in the univariate analysis (foveal: 108 ms, contralateral left: 116 ms, contralateral right: 120 ms). For the foveal location, the decoding analysis yielded a significant difference between upright and inverted letters 12 ms earlier than the univariate analysis, which suggests that the decoding method has greater power. For the left and right locations, however, the onset of significant decoding was slightly later compared to the univariate analysis of the electrode clusters contralateral to presentation side (4 ms and 8 ms, respectively). This indicates that for the foveal stimuli, the decoding analysis was able to pick up on information about letter inversion slightly earlier in the ERP signal, but for the lateralized stimuli, the decoding analysis was not able to leverage information that was not already in the amplitudes measured in the contralateral electrode clusters used for the univariate analysis. Hence, we did not observe that the decoding approach had greater power than the univariate approach in all cases.
One difference between the two approaches is that for the decoding analysis, inversion was significantly decoded far above chance until the final time point in the analysis window (300 ms), while in the univariate analyses the effect diminished after the N170. This is likely due to the stimulus being represented differently after the N170 (e.g., being encoded into working memory), in a way that is not evident from amplitudes at posterior electrode clusters.
Footnotes
There is inherent ambiguity in assigning effects to specific ERP components, because it is difficult to know if the same component is being measured in different experimental paradigms (Kappenman & Luck, 2013). In this article, we will describe ERP responses to orthographic stimuli (such as letters and words) during the N1 timeframe as orthographic N170 effects, but this is intended to indicate the polarity and time period of the effects and should not be taken to imply that a single latent component is being described in all of these studies.
Note that all our participants were university students who had a relatively high degree of reading proficiency. This may increase our ability to detect effects of letter inversion, but it may also limit the generalizability of our findings.
References
- Carrasco CD, Bahle B, Simmons AM, & Luck SJ (2024). Using multivariate pattern analysis to increase effect sizes for event-related potential analyses. Psychophysiology, 61, e14570. 10.1111/psyp.14570 [DOI] [PMC free article] [PubMed] [Google Scholar]
References
- Amora KK, Tretow A, Verwimp C, Tijms J, Leppänen PH, & Csépe V (2022). Typical and atypical development of visual expertise for print as indexed by the visual word N1 (N170w): a systematic review. Frontiers in Neuroscience, 16, 898800. 10.3389/fnins.2022.898800 [DOI] [PMC free article] [PubMed] [Google Scholar]
- Bates D, Mächler M, Bolker B, & Walker S (2014). Fitting linear mixed-effects models using lme4. arXiv preprint arXiv:1406.5823. 10.18637/jss.v067.i01 [DOI] [Google Scholar]
- Bae GY, & Luck SJ (2018). Dissociable decoding of spatial attention and working memory from EEG oscillations and sustained potentials. Journal of Neuroscience, 38(2), 409–422. 10.1523/JNEUROSCI.2860-17.2017 [DOI] [PMC free article] [PubMed] [Google Scholar]
- Benjamini Y, & Hochberg Y (1995). Controlling the false discovery rate: a practical and powerful approach to multiple testing. Journal of the Royal statistical society: series B (Methodological), 57(1), 289–300. 10.1111/j.2517-6161.1995.tb02031.x [DOI] [Google Scholar]
- Bentin S, Allison T, Puce A, Perez E, & McCarthy G (1996). Electrophysiological studies of face perception in humans. Journal of cognitive neuroscience, 8(6), 551–565. 10.1162/jocn.1996.8.6.551 [DOI] [PMC free article] [PubMed] [Google Scholar]
- Bentin S, Mouchetant-Rostaing Y, Giard MH, Echallier JF, & Pernier J (1999). ERP manifestations of processing printed words at different psycholinguistic levels: time course and scalp distribution. Journal of cognitive neuroscience, 11(3), 235–260 10.1162/089892999563373 [DOI] [PubMed] [Google Scholar]
- Binder JR, Medler DA, Westbury CF, Liebenthal E, & Buchanan L (2006). Tuning of the human left fusiform gyrus to sublexical orthographic structure. Neuroimage, 33(2), 739–748. 10.1016/j.neuroimage.2006.06.053 [DOI] [PMC free article] [PubMed] [Google Scholar]
- Blackburne LK, Eddy MD, Kalra P, Yee D, Sinha P, & Gabrieli JD (2014). Neural correlates of letter reversal in children and adults. PLoS One, 9(5), e98386. 10.1371/journal.pone.0098386 [DOI] [PMC free article] [PubMed] [Google Scholar]
- Carrasco CD, Bahle B, Simmons AM, & Luck SJ (2024). Using multivariate pattern analysis to increase effect sizes for event-related potential analyses. Psychophysiology, e14570. 10.1111/psyp.14570 [DOI] [PMC free article] [PubMed] [Google Scholar]
- Chang C, & Lin C (2011) LIBSVM : a library for support vector machines. ACM Transactions on Intelligent Systems and Technology, 2:27:1--27:27 10.1145/1961189.1961199 [DOI] [Google Scholar]
- Chen Y, Davis MH, Pulvermüller F, & Hauk O (2015). Early visual word processing is flexible: Evidence from spatiotemporal brain dynamics. Journal of Cognitive Neuroscience, 27(9), 1738–1751. 10.1162/jocn_a_00815 [DOI] [PubMed] [Google Scholar]
- Chen C-M, Lakatos P, Shah AS, Mehta AD, Givre SJ, Javitt DC, & Schroeder CE (2007). Functional Anatomy and Interaction of Fast and Slow Visual Pathways in Macaque Monkeys. Cerebral Cortex, 17(7), 1561–1569. 10.1093/cercor/bhl067 [DOI] [PubMed] [Google Scholar]
- Chopin A, Bediou B, & Bavelier D (2019). Altering perception: the case of action video gaming. Current Opinion in Psychology, 29, 168–173. 10.1016/j.copsyc.2019.03.004 [DOI] [PubMed] [Google Scholar]
- Cohen L, & Dehaene S (2004). Specialization within the ventral stream: the case for the visual word form area. Neuroimage, 22(1), 466–476. 10.1016/j.neuroimage.2003.12.049 [DOI] [PubMed] [Google Scholar]
- Dehaene S, & Cohen L (2007). Cultural recycling of cortical maps. Neuron, 56(2), 384–398. 10.1016/j.neuron.2007.10.004 [DOI] [PubMed] [Google Scholar]
- Dehaene S, Cohen L, Morais J, & Kolinsky R (2015). Illiterate to literate: behavioural and cerebral changes induced by reading acquisition. Nature Reviews Neuroscience, 16(4), 234–244. 10.1038/nrn3924 [DOI] [PubMed] [Google Scholar]
- Dehaene S, Jobert A, Naccache L, Ciuciu P, Poline JB, Le Bihan D, & Cohen L (2004). Letter binding and invariant recognition of masked words: behavioral and neuroimaging evidence. Psychological science, 15(5), 307–313. 10.1111/j.0956-7976.2004.00674.x [DOI] [PubMed] [Google Scholar]
- Dehaene S, Pegado F, Braga LW, Ventura P, Filho GN, Jobert A, ... & Cohen L (2010). How learning to read changes the cortical networks for vision and language. Science, 330(6009), 1359–1364. 10.1126/science.1194140 [DOI] [PubMed] [Google Scholar]
- Delorme A, & Makeig S (2004). EEGLAB: an open source toolbox for analysis of single-trial EEG dynamics including independent component analysis. Journal of neuroscience methods, 134(1), 9–21. 10.1016/j.jneumeth.2003.10.009 [DOI] [PubMed] [Google Scholar]
- Foxe JJ, Simpson GV Flow of activation from V1 to frontal cortex in humans. Exp Brain Res 142, 139–150 (2002). 10.1007/s00221-001-0906-7 [DOI] [PubMed] [Google Scholar]
- Grainger J (2018). Orthographic processing: A ‘mid-level’ vision of reading: The 44th Sir Frederic Bartlett Lecture. Quarterly Journal of Experimental Psychology, 71(2), 335–359. 10.1080/17470218.2017.1314515 [DOI] [PubMed] [Google Scholar]
- Grootswagers T, Wardle SG, & Carlson TA (2017). Decoding dynamic brain patterns from evoked responses: A tutorial on multivariate pattern analysis applied to time series neuroimaging data. Journal of Cognitive Neuroscience, 29(4), 677–697. 10.1162/jocn_a_01068 [DOI] [PubMed] [Google Scholar]
- Groppe DM, Urbach TP, & Kutas M (2011). Mass univariate analysis of event-related brain potentials/fields I: A critical tutorial review. Psychophysiology, 48(12), 1711–1725. 10.1111/j.1469-8986.2011.01273.x [DOI] [PMC free article] [PubMed] [Google Scholar]
- Hauk O, Davis MH, Ford M, Pulvermüller F, & Marslen-Wilson WD (2006). The time course of visual word recognition as revealed by linear regression analysis of ERP data. Neuroimage, 30(4), 1383–1400. 10.1016/j.neuroimage.2005.11.048 [DOI] [PubMed] [Google Scholar]
- Kanwisher N, & Yovel G (2006). The fusiform face area: a cortical region specialized for the perception of faces. Philosophical Transactions of the Royal Society B: Biological Sciences, 361(1476), 2109–2128. 10.1098/rstb.2006.1934 [DOI] [PMC free article] [PubMed] [Google Scholar]
- Kappenman ES, & Luck SJ (2013). ERP Components: The Ups and Downs of Brainwave Recordings. Luck Steven J. and Kappenman Emily S.. The Oxford handbook of event-related potential components, 3 [Google Scholar]
- Kim AE, & Straková J (2012). Concurrent effects of lexical status and letter-rotation during early stage visual word recognition: Evidence from ERPs. Brain research, 1468, 52–62. 10.1016/j.brainres.2012.04.008 [DOI] [PubMed] [Google Scholar]
- Kuznetsova A, Brockhoff PB, Christensen RHB (2017). “lmerTest Package: Tests in Linear Mixed Effects Models.” Journal of Statistical Software, 82(13), 1–26. 10.18637/jss.v082.i13 [DOI] [Google Scholar]
- Li W (2016). Perceptual learning: Use-dependent cortical plasticity. Annual Review of Vision Science, 2, 109–130. 10.1146/annurev-vision-111815-114351 [DOI] [PubMed] [Google Scholar]
- Ling S, Lee AC, Armstrong BC, & Nestor A (2019). How are visual words represented? Insights from EEG-based visual word decoding, feature derivation and image reconstruction. Human brain mapping, 40(17), 5056–5068. 10.1002/hbm.24757 [DOI] [PMC free article] [PubMed] [Google Scholar]
- Lopez-Calderon J, & Luck SJ (2014). ERPLAB: an open-source toolbox for the analysis of event-related potentials. Frontiers in human neuroscience, 8, 213. 10.3389/fnhum.2014.00213 [DOI] [PMC free article] [PubMed] [Google Scholar]
- Luck SJ (2014). An introduction to the event-related potential technique. MIT press. [Google Scholar]
- Lui KF, Lo JC, Maurer U, Ho CSH, & McBride C (2021). Electroencephalography decoding of Chinese characters in primary school children and its prediction for word reading performance and development. Developmental Science, 24(3), e13060. 10.1111/desc.13060 [DOI] [PubMed] [Google Scholar]
- Maurer U, Brem S, Kranz F, Bucher K, Benz R, Halder P, ... & Brandeis D (2006). Coarse neural tuning for print peaks when children learn to read. Neuroimage, 33(2), 749–758. 10.1016/j.neuroimage.2006.06.025 [DOI] [PubMed] [Google Scholar]
- Maurer U, & McCandliss BD (2007). The development of visual expertise for words: the contribution of electrophysiology. In Single-word reading (pp. 57–77). Psychology Press. [Google Scholar]
- Nara S, Raza H, Carreiras M, & Molinaro N (2023). Decoding numeracy and literacy in the human brain: insights from MEG and MVPA. Scientific Reports, 13(1), 10979. 10.1038/s41598-023-37113-0 [DOI] [PMC free article] [PubMed] [Google Scholar]
- Peirce JW (2007). PsychoPy-psychophysics software in Python. Journal of neuroscience methods, 162(1–2), 8–13. 10.1016/j.jneumeth.2006.11.017 [DOI] [PMC free article] [PubMed] [Google Scholar]
- Pegado F, Comerlato E, Ventura F, Jobert A, Nakamura K, Buiatti M, ... & Dehaene S (2014). Timing the impact of literacy on visual processing. Proceedings of the National Academy of Sciences, 111(49), E5233–E5242. 10.1073/pnas.1417347111 [DOI] [PMC free article] [PubMed] [Google Scholar]
- Price CJ, & Devlin JT (2011). The interactive account of ventral occipitotemporal contributions to reading. Trends in cognitive sciences, 15(6), 246–253. 10.1016/j.tics.2011.04.001 [DOI] [PMC free article] [PubMed] [Google Scholar]
- Rayner K, Slattery TJ, & Bélanger NN (2010). Eye movements, the perceptual span, and reading speed. Psychonomic bulletin & review, 17(6), 834–839. 10.3758/PBR.17.6.834 [DOI] [PMC free article] [PubMed] [Google Scholar]
- Rossion B, Gauthier I, Tarr MJ, Despland P, Bruyer R, Linotte S, & Crommelinck M (2000). The N170 occipito-temporal component is delayed and enhanced to inverted faces but not to inverted objects: an electrophysiological account of face-specific processes in the human brain. Neuroreport, 11(1), 69–72. 10.1097/00001756-200001170-00014 [DOI] [PubMed] [Google Scholar]
- Rossion B, Joyce CA, Cottrell GW, & Tarr MJ (2003). Early lateralization and orientation tuning for face, word, and object processing in the visual cortex. Neuroimage, 20(3), 1609–1624. 10.1016/j.neuroimage.2003.07.010 [DOI] [PubMed] [Google Scholar]
- Schmolesky MT, Wang Y, Hanes DP, Thompson KG, Leutgeb S, Schall JD, & Leventhal AG (1998). Signal timing across the macaque visual system. Journal of Neurophysiology, 79, 3272–3278. 10.1152/jn.1998.79.6.3272 [DOI] [PubMed] [Google Scholar]
- Schotter ER, Angele B & Rayner K Parafoveal processing in reading. Atten Percept Psychophys 74, 5–35 (2012). 10.3758/s13414-011-0219-2 [DOI] [PubMed] [Google Scholar]
- Schroeder CE, Mehta AD, & Givre SJ (1998). A spatiotemporal profile of visual system activation revealed by current source density analysis in the awake macaque. Cerebral cortex, 8(7), 575–592. 10.1093/cercor/8.7.575 [DOI] [PubMed] [Google Scholar]
- Stevens C, McIlraith A, Rusk N, Niermeyer M, & Waller H (2013). Relative laterality of the N170 to single letter stimuli is predicted by a concurrent neural index of implicit processing of letternames. Neuropsychologia, 51(4), 667–674. 10.1016/j.neuropsychologia.2012.12.009 [DOI] [PubMed] [Google Scholar]
- Szwed M, Dehaene S, Kleinschmidt A, Eger E, Valabrègue R, Amadon A, & Cohen L (2011). Specialization for written words over objects in the visual cortex. Neuroimage, 56(1), 330–344. 10.1016/j.neuroimage.2011.01.073 [DOI] [PubMed] [Google Scholar]
- Szwed M, Qiao E, Jobert A, Dehaene S, & Cohen L (2014). Effects of literacy in early visual and occipitotemporal areas of Chinese and French readers. Journal of cognitive neuroscience, 26(3), 459–475. 10.1162/jocn_a_00499 [DOI] [PubMed] [Google Scholar]
- Toussi N, Takai O, Bann S, Rowe J, Hildebrand AJ, & Herdman A (2023). Combined studies of N170/M170 responses to single letters and pseudoletters. bioRxiv, 2023–10. 10.1101/2023.10.13.562197 [DOI] [Google Scholar]
- Uno T, Kasai T, & Seki A (2024). The Developmental Change of Print-Tuned N170 in Highly Transparent Writing Systems 1. Japanese Psychological Research, 66(1), 82–89. 10.1111/jpr.12397 [DOI] [Google Scholar]
- Winsler K, Grainger J, & Holcomb PJ (2022). On letter-specific crowding and reading: Evidence from ERPs. Neuropsychologia, 176, 108396. 10.1016/j.neuropsychologia.2022.108396 [DOI] [PubMed] [Google Scholar]
- Winsler K, Holcomb PJ, & Emmorey K (2023). Electrophysiological patterns of visual word recognition in deaf and hearing readers: an ERP mega-study. Language, cognition and neuroscience, 38(5), 636–650. 10.1080/23273798.2022.2135746 [DOI] [PMC free article] [PubMed] [Google Scholar]
- Winsler K, Luck SJ (in press) A lifetime of reading experience facilitates the perception of crowded letters. Journal of Memory and Language. [Google Scholar]
- Zhao J, Kipp K, Gaspar C, Maurer U, Weng X, Mecklinger A, & Li S (2014). Fine neural tuning for orthographic properties of words emerges early in children reading alphabetic script. Journal of Cognitive Neuroscience, 26(11), 2431–2442. 10.1162/jocn_a_00660 [DOI] [PubMed] [Google Scholar]
- Zhang G, Carrasco CD, Winsler K, Bahle B, Cong F, & Luck SJ (2024). Assessing the effectiveness of spatial PCA on SVM-based decoding of EEG data. NeuroImage, 293, 120625. 10.1016/j.neuroimage.2024.120625 [DOI] [PMC free article] [PubMed] [Google Scholar]
- Zhang W, & Kappenman ES (2024). Maximizing signal-to-noise ratio and statistical power in ERP measurement: Single sites versus multi-site average clusters. Psychophysiology, 61(2), e14440. 10.1111/psyp.14440 [DOI] [PubMed] [Google Scholar]