
FIG. 2.
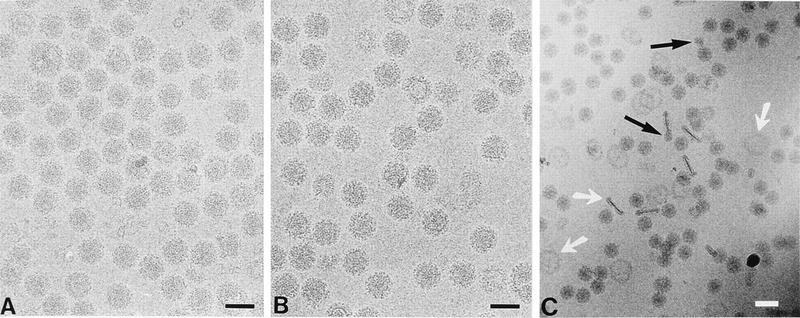
Selected regions of 100-kV flood-beam electron cryomicrographs of TRSB (wt) (A), TRSB-N (noninfectious mutant) (B), and TRSB-NE2G216 (infectious mutant) (C). In the case of the infectious mutant, the magnification is lowered to display a larger field of the specimen area. The white arrows indicate collapsed virus envelopes, while the black arrows indicate free nucleocapsids. Black scale bars, 700 Å; white scale bar, 1,000 Å.