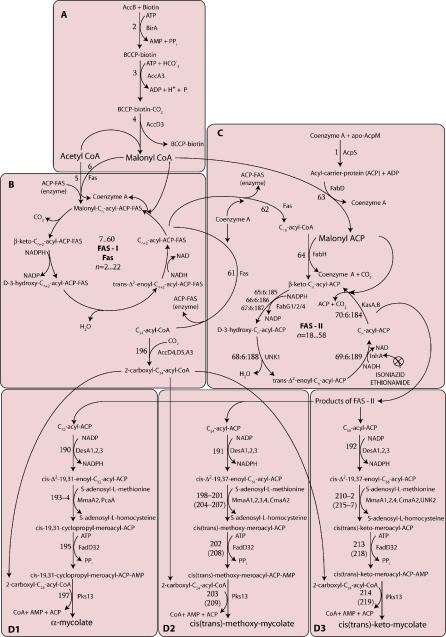
Figure 1. Schematic Diagram of the MAP in M. tuberculosis .
(A–D) refer to the four sub-pathways (see text). The key metabolites are indicated in larger type. Proteins catalysing each reaction are indicated to the right of the reaction arrows, while the reaction numbers are indicated to the left. Reaction cycles have been indicated as, for instance, 65:6:185 (for fabG1), which is to be interpreted as 65, 71, 77, ..., 185. ⊗ indicates inhibition of InhA by isoniazid and ethionamide in the pathway. The reaction numbers in parentheses indicate reactions for the trans forms in (D2) and (D3).

