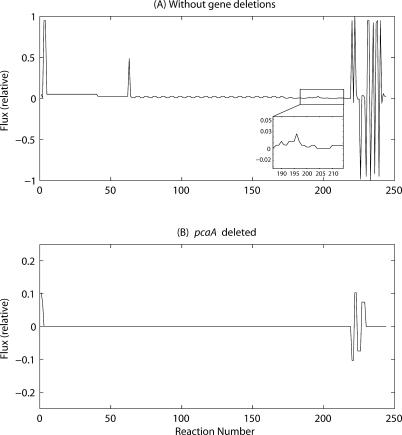
Figure 3. Flux Distributions Obtained from FBA Using the MAP Model and Objective Function c 2 .
(A) in an unperturbed state, (B) upon deletion of pcaA. Inset in A refers to an enlarged version of the indicated portion. Note that the scale for (B) is different. It may be noted that the lines joining the various flux points have been drawn to aid in discerning the flux peaks clearly; the lines as such have no physical significance.

