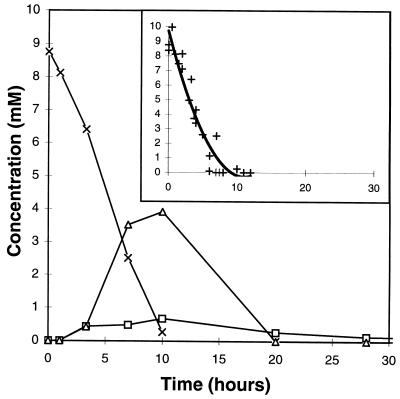
FIG. 4.
Time courses for the concentrations of morpholine (×), glycolate (▵), and 2-(2-aminoethoxy)acetate (□) during the degradation of morpholine (10 mM) by M. aurum MO1 cells at 100 g · liter−1. The quantification was made by integrating the signals in 1H-NMR spectra relative to the area for the reference TSPd4 (see Fig. 2). (Inset) Data from five independant experiments concerning the degradation of morpholine; a polynomial calculation was used to plot the final curve.

