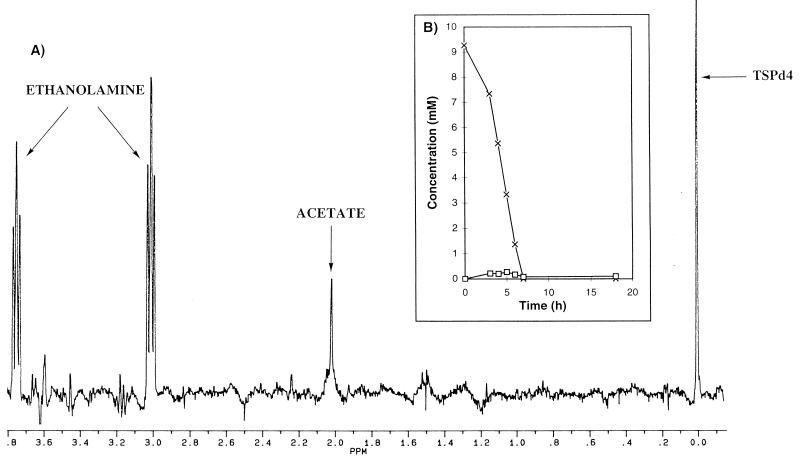
FIG. 5.
Kinetics of degradation of ethanolamine (10 mM) by M. aurum MO1 (100 g · liter−1). The conditions were as described for Fig. 2. (A) 1H-NMR spectrum collected after 5 h of incubation. (B) Time courses for the concentrations of ethanolamine (×) and acetate (□).

