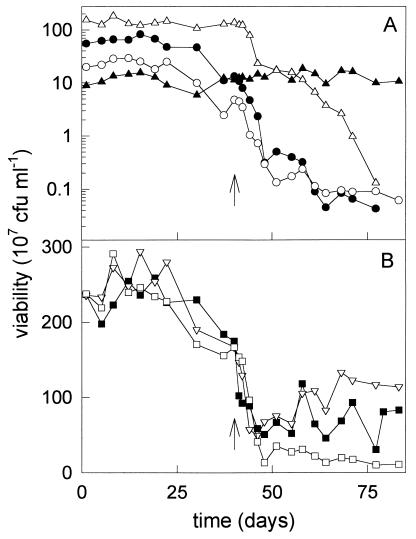
FIG. 3.
Population composition (A) and viability (B) of the fed-batch culture over time, determined as CFU on different agar plates. Symbols: •, P. putida GJ31 on chlorobenzene plates; ▴, P. putida mt-2 on p-xylene plates; ○, B. cepacia G4 on o-cresol plates; ▵, P. putida F1, determined as the difference between the viability on m-cresol and o-cresol plates; ▪, viability on NB plates, ▿, viability on Tol plates; □, sum of viabilities of the four strains on selective plates; ↑, time at which TCE addition was started.

