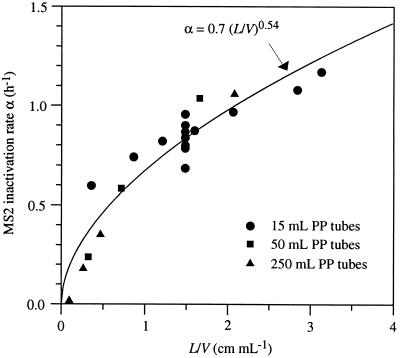
FIG. 4.
Relationship between MS2 inactivation rate (α) and the ratio of TPB to virus solution volume (L/V). Experiments were performed with 15-, 50-, and 250-ml PP tubes. All vessels were mixed for 3 h at 7 ± 1°C. The data were fit to the exponential equation α = a(L/V)b, where a and b are, respectively, 0.7 and 0.54. To determine whether the relationship held for various concentrations as well as for a constant concentration of MS2, control blank data from Table 1 were used in conjunction with data from Table 2.

