
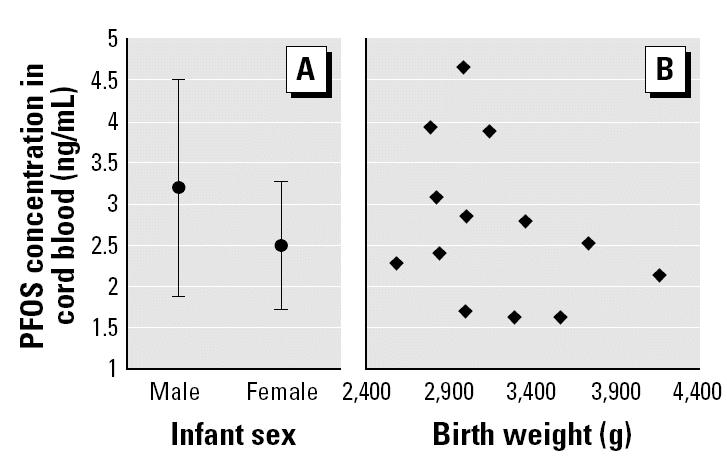
Figure 3. Infants’ sex (A) and birth weight (B) plotted against PFOS concentration in cord blood samples (n = 15). Error bars indicate mean ± SD.
Official websites use .gov
A
.gov website belongs to an official
government organization in the United States.
Secure .gov websites use HTTPS
A lock (
) or https:// means you've safely
connected to the .gov website. Share sensitive
information only on official, secure websites.