. 2004 Sep 14;112(16):1607–1613. doi: 10.1289/txg.7204

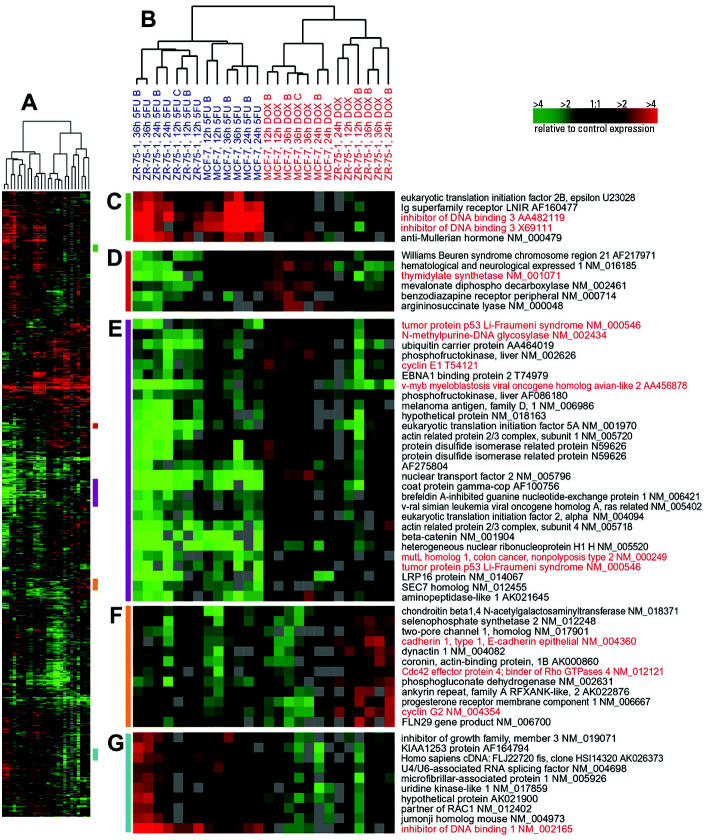
Figure 1. Gene expression patterns for genes that distinguish between DOX- and 5FU-treated luminal cells (MCF-7 and ZR-75-1). Hierarchical clustering analysis was conducted using 13 DOX-treated and 13 5FU-treated samples. Data from the union of the genes identified by SAM for MCF-7 and ZR-75-1 were identified and combined into a nonredundant list, and the compressed cluster is shown in A (complete cluster is available in Supplemental Data, Figure 1). Colored bars on right side of A illustrate the location of clusters shown in CG. The dendrogram in B shows that the samples clustered into two groups according to treatment (DOX experiments labeled in red, 5FU experiments labeled in blue), but within each treatment branch, cell line–specific branches are also identifiable. Gene names and accession numbers are from Unigene (http://www.ncbi.nlm.nih.gov/entrez/query.fcgi?db=unigene). Gene names and accession numbers highlighted in red are discussed in text.

Figure 1