. 2004 Sep 14;112(16):1607–1613. doi: 10.1289/txg.7204

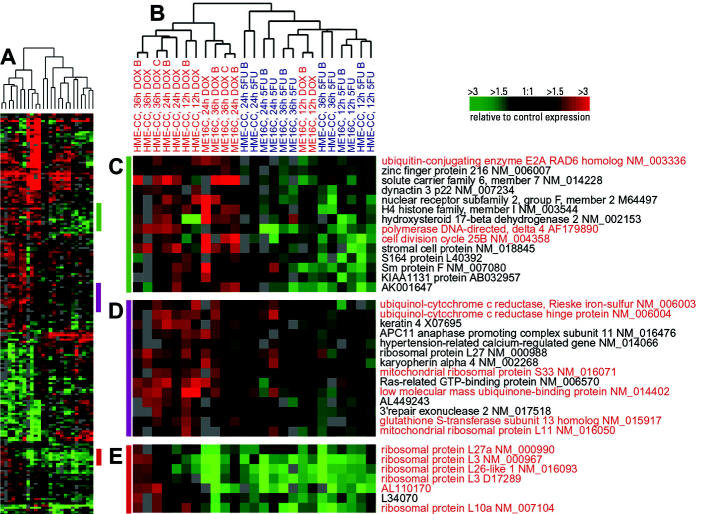
Figure 2. Gene expression patterns for genes that distinguish between DOX- and 5FU-treated basal-like cells (ME16C and HME-CC). Hierarchical clustering analysis was conducted using 13 DOX-treated and 12 5FU-treated samples. Data from the union of the genes identified by SAM for ME16C and HME-CC were identified and combined into a nonredundant list, and the compressed cluster is shown in A (complete cluster available in Supplemental Data, Figure 2). Colored bars in A illustrate the location of clusters shown in CE. The dendrogram in B shows that the samples clustered into two groups according to treatment (DOX experiments labeled in red, 5FU experiments labeled in blue); however, there early time points for DOX-treated ME16C samples clustered with the 5FU-treated samples. Gene names and accession numbers are from Unigene (http://www.ncbi.nlm.nih.gov/entrez/query.fcgi?db=unigene). Gene names and accession numbers highlighted in red are discussed in text.

Figure 2