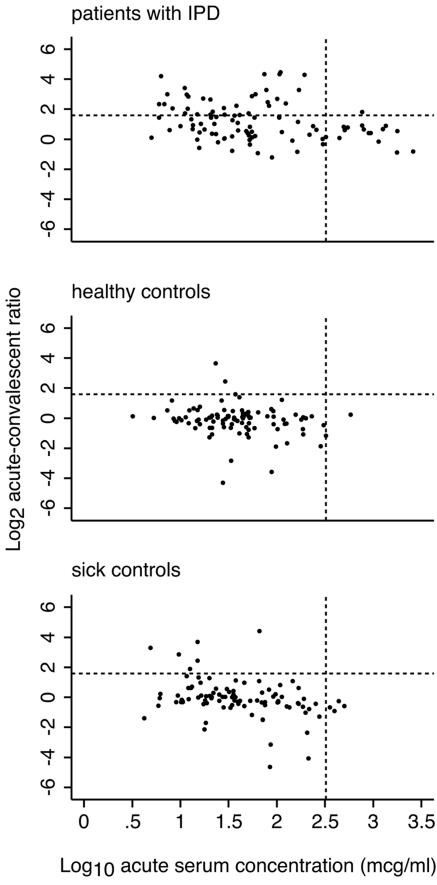
FIG. 3.
Scatter plots of convalescent/acute-phase concentration ratios against acute-phase concentrations of anti-PsaA for three study groups. Dots represent individual patients within the three study groups: (A) patients with IPD, n = 98; (B) healthy controls, n = 97; (C) sick controls, n = 95. Convalescent/acute-phase ratios have been transformed to log2 and acute-phase concentrations to log10. Dotted lines indicate the thresholds selected from the scatter plots to optimize sensitivity in IPD patients and specificity in healthy controls.

