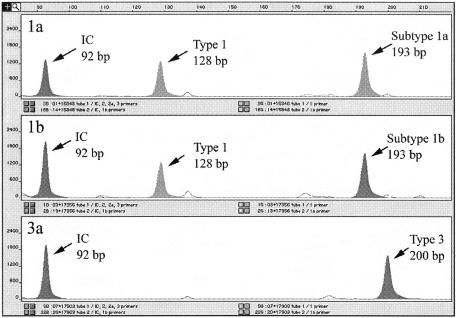
FIG. 1.
Typical PSEA-HCV results. Electropherograms generated from the PSEA-HCV of HCV-positive patient plasma containing HCV genotypes 1a, 1b, and 3a. All peaks for each sample have been superimposed within the same panel to facilitate analysis. The actual peak sizes are indicated and are within 1 bp of the predicted sizes.

