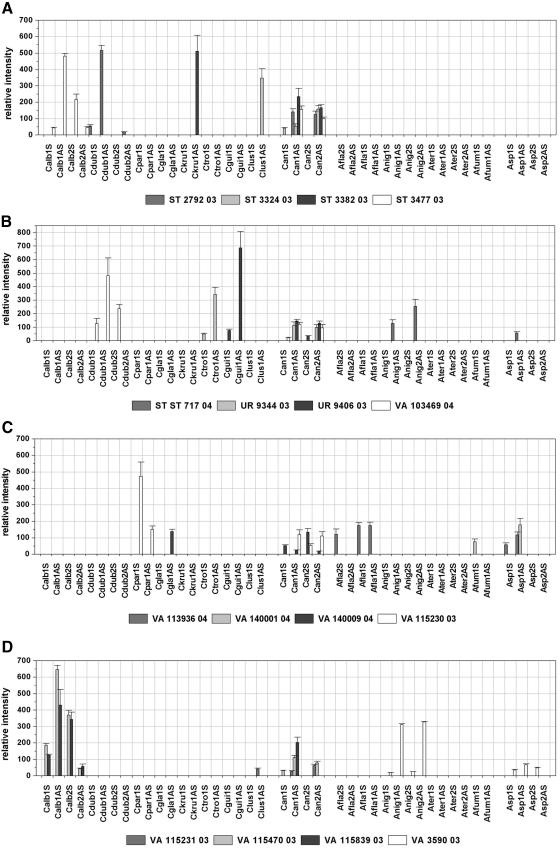
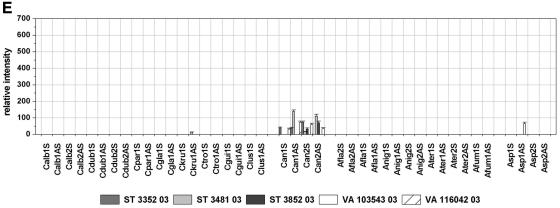
FIG. 4.
Relative intensities after hybridization with labeled target DNA from blinded samples of clinical isolates. Cutoffs 1 and 2 are as described in the legend to Fig. 2. The columns depict mean relative signal intensities and their standard deviations over three slides of the same experiment (n = 9).


