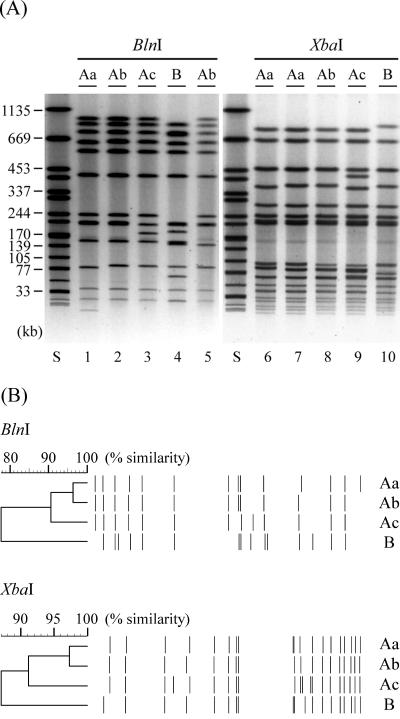
FIG. 1.
(A) Representative PFGE profiles of high-level fluoroquinolone-resistant strains of S. enterica serovar Typhimurium. Total DNA of isolates no. 0 (lanes 1 and 6), no. 2 (lanes 2 and 7), no. 5 (lanes 3 and 8), no. 8 (lanes 4 and 9), and no. 100 (lanes 5 and 10) was digested with BlnI (lanes 1 to 5) or XbaI (lanes 6 to 10). Lane S, S. enterica serovar Braenderup H9812 digested with XbaI. Sizes of the bands of H9812 are indicated on the left. Genotypes from Table 2 are indicated at the top of the panel. (B) Dendrograms calculated using the representative PFGE profiles. The top part of the panel is based on the BlnI-digested profiles. The lower part is based on the XbaI-digested profiles. Genotypes are indicated on the right.

