
Figure 6.
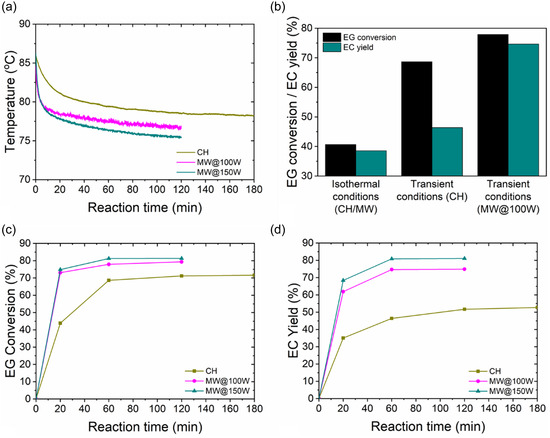
a) Temporal temperature profiles, b) comparison of EG conversion and EC yield under isothermal and transient conditions, c) temporal EG conversion, and d) EC yield profiles under CH and MWH (at 100 and 150 W) at reflux conditions (reaction conditions: DMC:EG ratio = 2.24:1, CaO loading = 0.1% w/wEG and t R = 1 h).