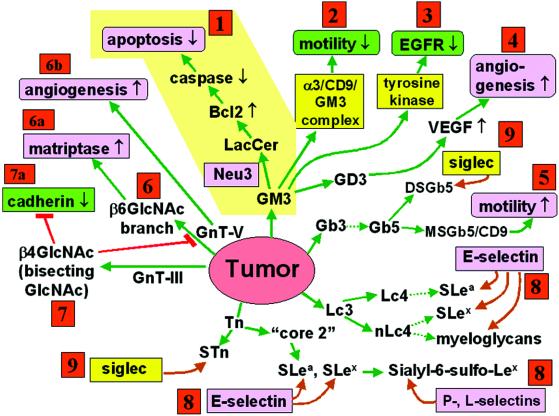
Fig 1.
Glycosylation defining malignancy (invasive and metastatic phenotype of tumors). Tumor cell malignancy is defined by several key phenotypes: apoptosis (route 1), motility (routes 2 and 5), EGF receptor tyrosine kinase (route 3), angiogenesis (routes 4 and 6b), matriptase (matrix-destroying enzyme) activity (route 6a), self-adhesion (through cadherin) (route 7a), adhesion to ECM (through integrin), adhesion to ECs and platelets (through E- or P-selectin) (route 8), adhesion to blood cells and other parenchymatous cells (through siglecs) (route 9). Each phenotype is up- or down-regulated (↑, ↓) by different status of glycosylation as explained in the text and indicated in the figure. Phenotypes with ↑ or ↓ and green color inhibit tumor invasiveness. Those with ↑ or ↓ and pink color promote invasiveness. Glycosyl epitopes capable of binding to specific ligands (pink color without arrow) promote invasiveness. Ligands with yellow color have variable or unclear effect on invasiveness. Note that a given phenotype is produced by different glycosylations, and a given glycosylation produces different phenotypes. Phenotypic changes have cooperative effects on malignancy. For example, GM3 inhibits motility through α3/CD9 complex and also inhibits EGF receptor tyrosine kinase (routes 2 and 3). Reduction of GM3 inhibits apoptosis (route 1), but promotes motility and proliferation (negative route 2 and 3 effect). Essentially all glycosylation pathways catalyzed by multiple glycosyltransferases and their genes are well established (for review see 2). However, the mechanism by which each type of glycosylation affects the various phenotypes remains to be studied. Structures of GSLs are abbreviated according to International Union of Pure and Applied Chemistry–International Union of Biochemistry nomenclature recommendations. S, sialyl; MS, monosialyl; DS, disialyl.

