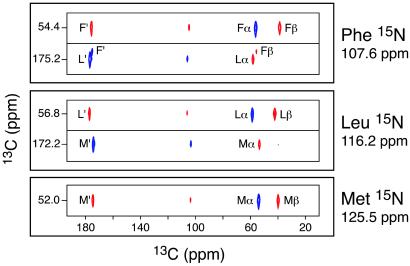
Fig 1.
Strip cross sections through the 15N planes of the 3D 15N–13C–13C chemical shift correlation spectrum of f-MLF-OH, showing the backbone resonance assignments. The Met 15N plane (125.5 ppm) shows only 13C cross-peaks from the Met residue. In contrast, the Leu 15N plane (116.2 ppm) shows Met and Leu 13C cross-peaks, and the Phe 15N plane (107.6 ppm) displays Leu and Phe 13C cross-peaks. Since 13C–13C correlations were established by using the SPC-5 double-quantum recoupling pulse sequence (31) the cross-peaks corresponding to subsequent 13C–13C dipolar transfers alternate in sign (28) (blue and red for positive and negative absorption, respectively). Details of the pulse sequence and experimental parameters used to record this spectrum can be found in ref. 22.

