Fig 4.
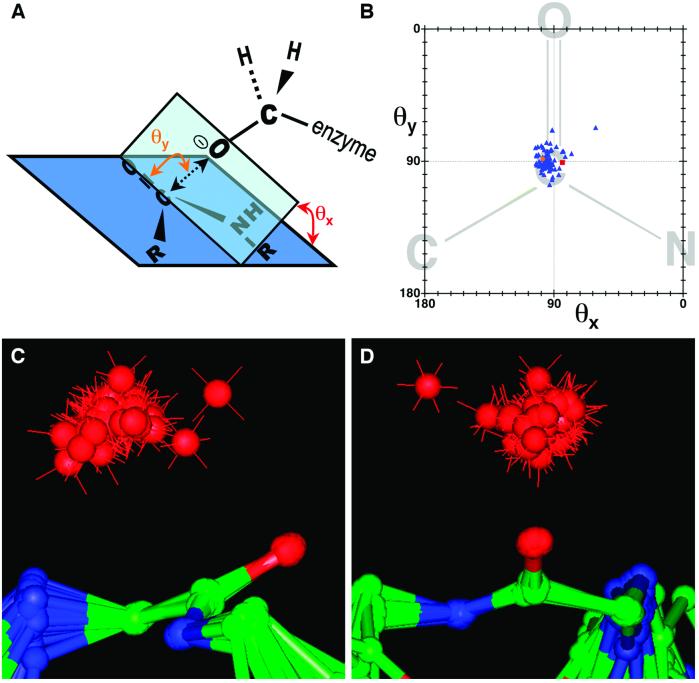
Nucleophilic attack trajectories for protease/inhibitor complexes. (A) The geometric parameters describing the nucleophilic attack trajectory are diagrammatically defined. θy is the angle defined by the enzyme serine γ-oxygen, the inhibitor carbonyl carbon, and the inhibitor carbonyl oxygen. θx is the angle between (i) the plane defined by the enzyme serine γ-oxygen, the inhibitor carbonyl carbon, and the inhibitor carbonyl oxygen, and (ii) the plane defined by the peptide bond. γO—C represents the distance between the enzyme serine γ-oxygen and the inhibitor carbonyl carbon. (B) Plot of θy vs. θx. Blue triangles represent the structures of 78 protease/inhibitor complexes, the orange circle represents the subtilisin/CI2 complex, and the red square represents the thrombin/fibrinogen analog structure (16). The peptide bond diagrammed in the background is for illustrative purposes. (C and D) Two views of the superposition of 79 protease/inhibitor complexes, including subtilisin/CI2. Superpositioning was based on the α-carbon and carbonyl oxygen of the P1 residue, and the amide nitrogen of the P residue, which overlay closely for all structures. The red spheres represent the relative positions of the enzyme serine γ-oxygen for each structure. The outlying structure apparent in B, C, and D is that of an ecotin mutant complexed with trypsin.

